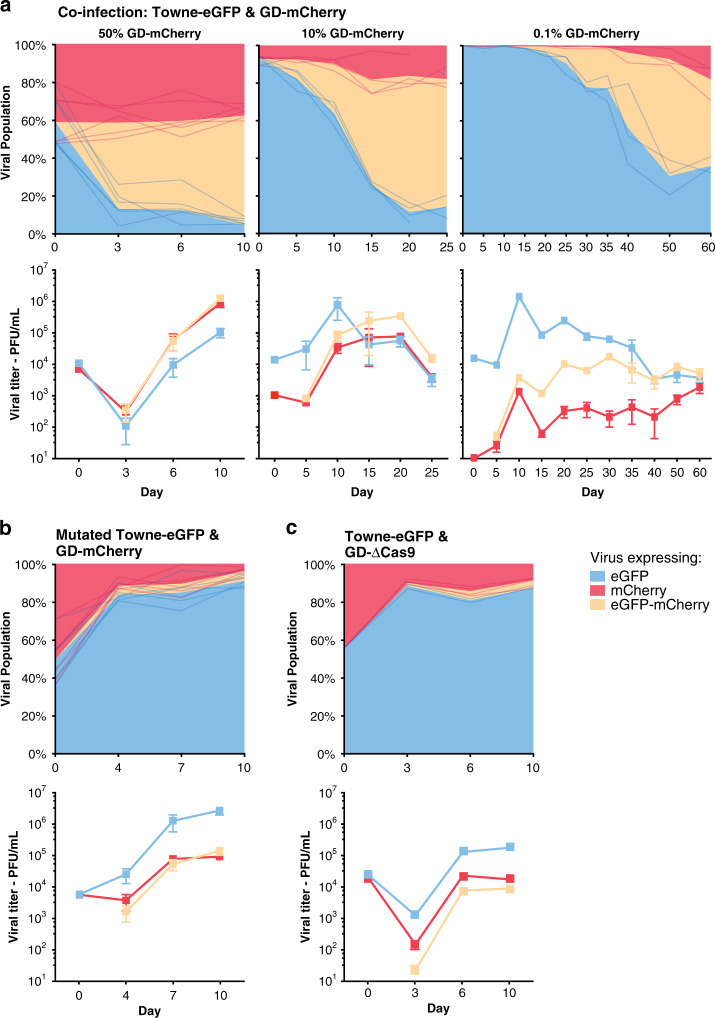
Fig. 4. Gene drive sequences efficiently spread into the wildtype population.
a Coinfection experiments between Towne-eGFP (MOI = 0.1 at day 0) and different starting concentration of GD-mCherry: Viral titers (lower panels) and proportion (upper panels) over time of viruses expressing eGFP alone, mCherry alone, or both as measured by plaque assay. Left panel: 50% of GD-mCherry at Day 0, n = 6; middle: 10% at D0, n = 4; right: 0.1% at D0, n = 3. b Viral titers and proportion of viruses after coinfection with equal amount of Towne-eGFP (with a mutated target site) and GD-mCherry. n = 6. c Viral titers and proportion of viruses after coinfection with equal amount of Towne-eGFP and GD-ΔCas9. n = 3. Titers are expressed in plaque forming unit (PFU) per mL of supernatant. Error bars represent standard error of the mean (SEM) between biological replicates. In the panels representing the viral population, data show both the mean and the individual trajectory of biological replicates. Source data are provided as a Source Data file.

