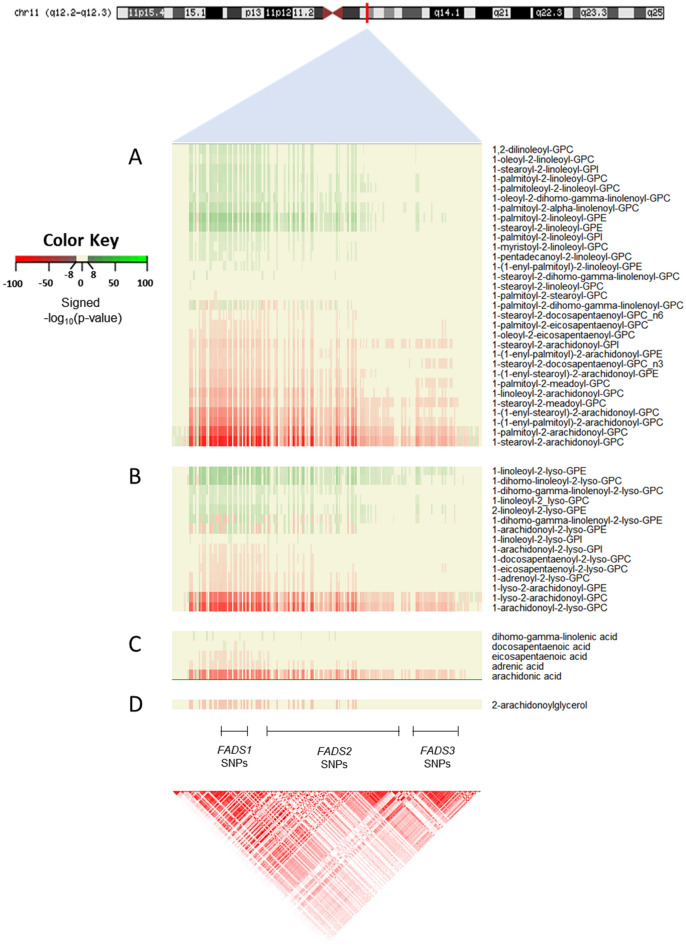
Figure 2.
FADS locus genetic variation associations with lipid metabolites. Heatmaps depicting the significance (− log10[p value]) and effect direction for associations between 52 metabolites and chromosome 11 SNPs in the FADS locus (± 100 kb) that reached a significance threshold (p < 1.2 × 10⁻⁸). The effect direction and significance of association between the alternative (alt) allele and the metabolite levels are depicted by color (see color key). Green color indicates significantly higher metabolite levels associated with increasing numbers of the SNP alt allele. In contrast, red depicts lower metabolite levels associated with increasing numbers of the alt allele. The neutral beige color indicates associations p ≥ 1.2 × 10⁻⁸. The heatmaps are separated by four major lipid classes including from top to bottom: (A) PL (31 metabolites), (B) lyso-PL (15 metabolites), (C) free fatty acid (5 metabolites), and (D) endocannabinoid (1 metabolite). The LD plot represents R2 values using the CEU population from the 1,000 Genomes Project.

