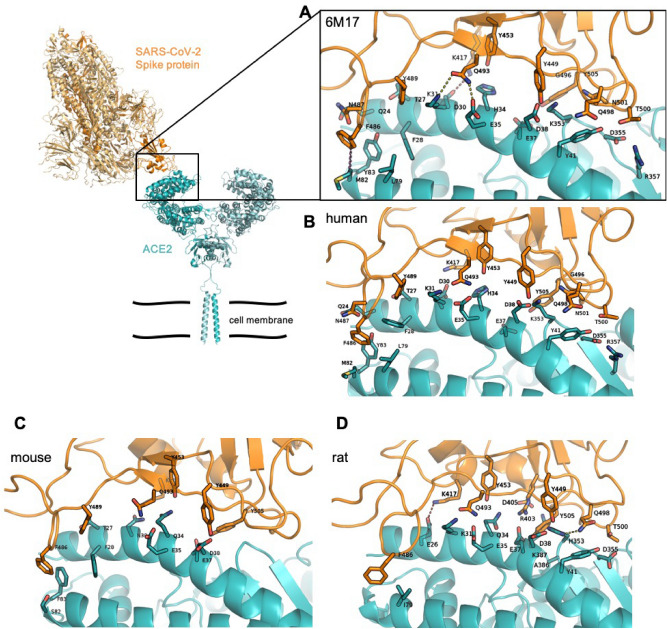
Figure 1.
ACE2 PD – SARS-CoV-2 S protein RBD interaction surface. Cartoon representation of the trimeric SARS-CoV-2 S protein (PDB ID 6VSB) with the human ACE2 dimer (PDB ID 6M17), with the S protein in orange and the ACE2 in teal. In the close-up panels, the residues involved in direct interactions (see Table 2) are shown as sticks, with the SARS-CoV-2 RBD in orange and the ACE2 in teal (cryo-EM structure (A), human model (B), mouse model (C), rat model (D)). H-bonds, salt bridges and hydrophobic interactions are shown as yellow, red and purple dotted lines respectively. The Q498-H353 H-bond and K417-E26 slat bridge present only in the rat complex are shown with a yellow and red dotted line respectively. All structures are in the same orientation.

