Figure 2.
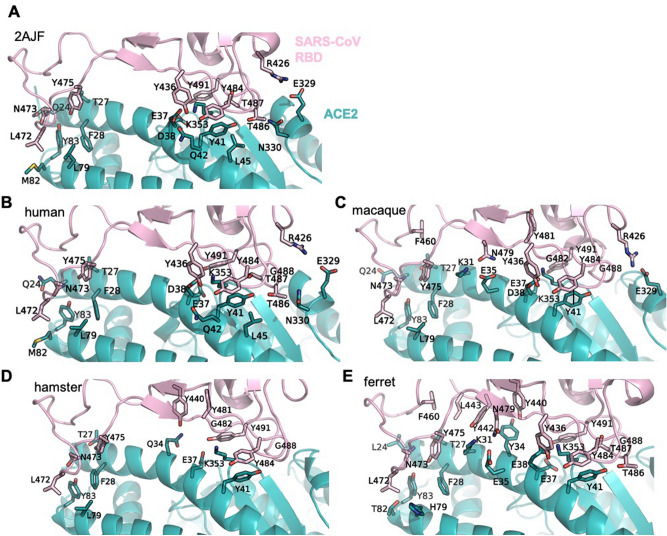
ACE2 PD – SARS-CoV S protein RBD interaction surface. Cartoon representation of the of the interaction surface of SARS-CoV RBD with ACE2 in the (A) X-RAY structure (PDB ID 2AJF), (B) human model, (C) macaque model, (D) hamster model and (E) ferret model. The residues involved in direct interactions (see Table 3) are shown as sticks, with the SARS-CoV RBD in pink and the ACE2 in teal. All structures are in the same orientation.

