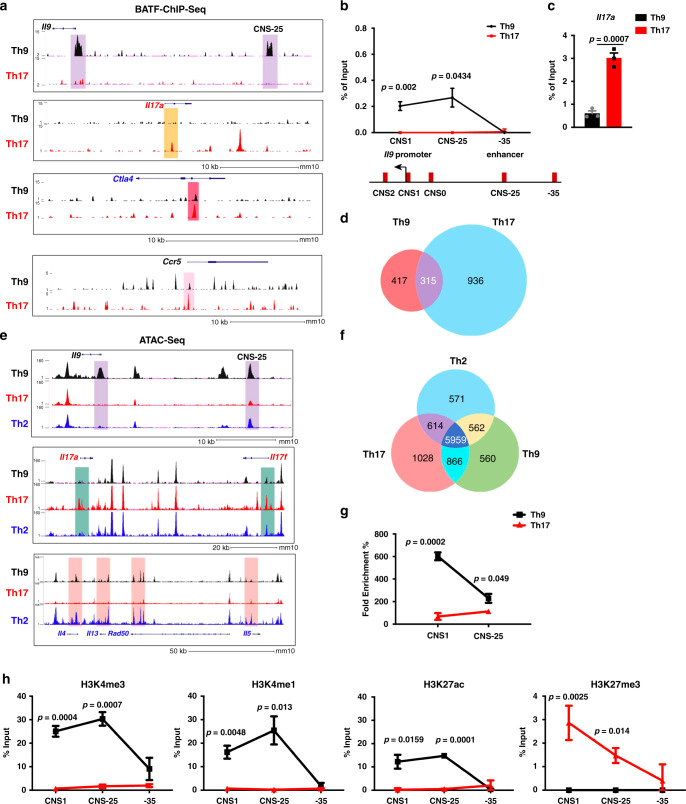
Fig. 1. Lineage-specific BATF binding and chromatin structure at the Il9 gene.
Naive CD4+ T cells were isolated from the spleen and differentiated into Th9 and Th17 cells for 5 days. ChIP assay and chromatin accessibility assay were performed on day 5. a BATF ChIP-seq-binding peaks in Th9 and Th17 cells on day 5 culture. b ChIP-qPCR analysis of BATF binding at the Il9 gene locus (top) on day 5 culture and diagram of the Il9 gene locus (bottom). c ChIP-qPCR analysis of BATF binding at the Il17 gene locus on day 5 culture. d Venn diagram indicating the overlap of BATF-binding peaks between Th9 and Th17 cells. e Genome browser view of ATAC-seq peaks in day 5 cultured Th9, Th17, and Th2 cells at the Il9, Il17a-Il17f, and Il4-Il13-Rad50-Il5 gene loci. f Venn diagram indicating the overlap of ATAC-seq peaks in promoter regions in Th9, Th17, and Th2 cells. g Chromatin accessibility analysis of Il9 gene locus in Th9 and Th17 cells on day 5 culture. h ChIP-qPCR analysis of the binding of H3K4me1, H3K4me3, H3K27ac, and H3K27me3 on Il9 locus on day 5 culture. b, c, g, h Data are the mean ± SEM of three mice per experiment and representative of two independent experiments. An unpaired two-tailed Student’s t-test was used for generating p-values. See also Supplementary Fig. 1.

