Fig. 3.
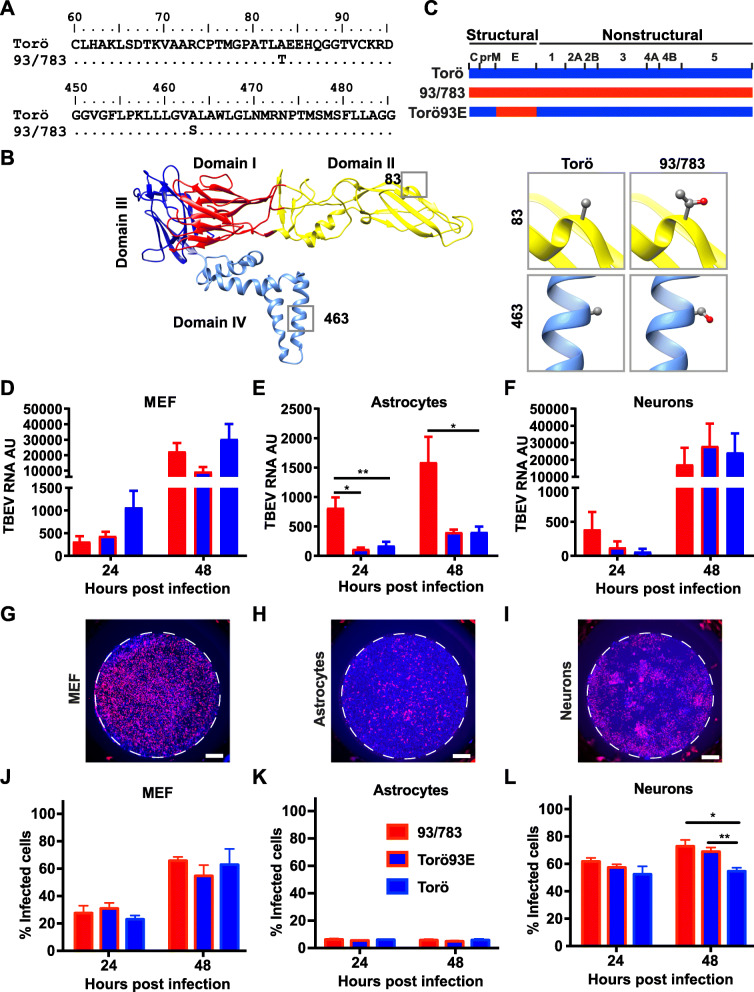
Sequence analysis, generation of chimeric TBEV virus, and infection rates in primary cells. a Sequence alignment of amino acid sequence of 93/783 and Torö using BioEdit software, displaying amino acid differences at residues 83 and 463; residues excluded from the alignment were the same in both strains. b (left panel) Single TBEV E protein monomer (PDB accession number 5O6A) showing the three extracellular domains DI (red), DII (yellow), and DIII (dark blue) and the transmembrane domain DIV (light blue). b (right panel) Magnification of the variations in E protein between TBEV strain Torö and 93/783 in domain II and domain IV. Residues A83 and A463 for strains Torö and T83 and S463 for strain 93/783 shown as ball and stick. Molecular graphics prepared using UCSF Chimera (https://www.cgl.ucsf.edu/chimera/). c The whole E protein from 93/783 was cloned into Torö in order to generate the chimeric strain Torö93E. MEFs (d, g, and j, MOI:0.1), astrocytes (e, h, and k, MOI:0.1) and cortical neurons (f MOI:0.001, i, and l, MOI:0.01) were infected with the indicated TBEV strains. Viral replication was determined by qPCR (d–f); viral RNA expression levels were calculated by normalizing to GAPDH expression using the ΔΔCT method and fold induction over the 3 h time point (input control). (g–i). Representative IF pictures of MEF, astrocytes, and neurons infected with 93/783 for 48 h, stained with anti-E monoclonal antibody (red) and Dapi, scale bar 1000 μM (j–l). Percentage of infected cells. Data are cumulative of two independent experiments performed in triplicates; statistical significance were calculated by parametric t test (*P < 0.05, **P < 0.01)

