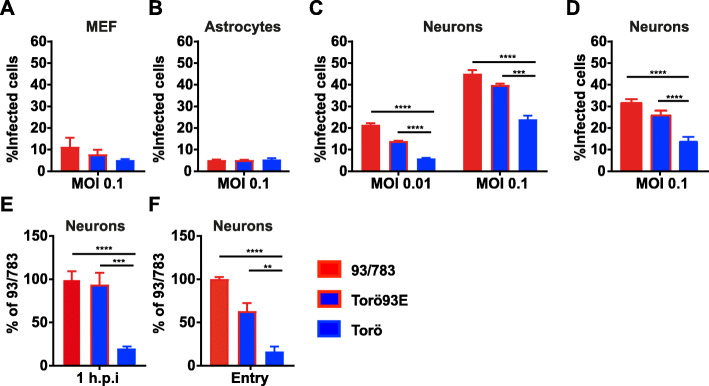
Fig. 4.
Percent cells infected during first round of infection and analysis of viral entry. Primary MEFs (a), astrocytes (b), and cortical neurons (c–d) were infected using the indicated TBEV strains. Cells were treated with 5 μg/mL brefeldin A 12 h.p.i, and 24 h.p.i cells were fixed using 4% formaldehyde and number of infected cells were determined by immunofluorescent staining of TBEV E protein followed by quantification using a TROPHOS Plate RUNNER HD (a–c) or FACS (d). e Cortical neurons were infected for 1 h (MOI:10), cells were washed and lysed and viral RNA measured by qPCR. Values are presented as % of RNA compared to 93/783, and expression was normalized to the endogenous GAPDH expression and calculated based on the ΔΔCT method. f Cells were infected for 1 h (MOI:10), washed, and incubated for 2 h at 37 °C. Bound but not entered, virus was removed by trypsin and cells were lysed, and RNA-quantified. Data are cumulative of at least two independent experiments performed in triplicates; statistical significance was calculated by parametric t test (*P < 0.05, **P < 0.01, ***P < 0.001, ****P < 0.0001)

