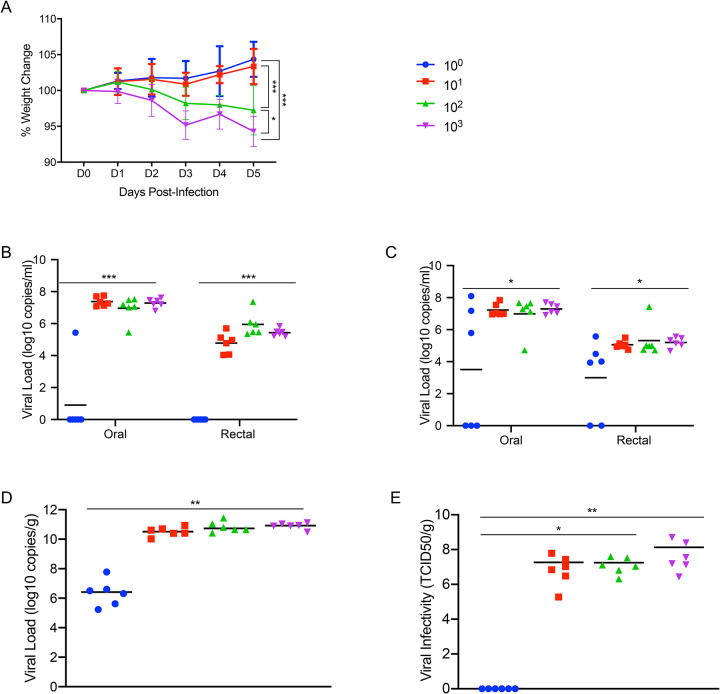
Figure 2: Susceptibility of Syrian hamsters to SARS-CoV-2.
Syrian hamsters were inoculated intranasally with 10-fold limiting dilutions of SARS-CoV-2 beginning at 103 TCID50. Weights were collected daily and shedding was assessed via swab samples (nasal and rectal) collected at 3dpi and 5dpi. Viral loads were determined as genome copies and infectious virus. (A) Daily weights. (B) Shedding at 3dpi. (C) Shedding at 5dpi. (D) Viral genome load in the lungs at 5dpi. (E) Infectious lung titers at 5dpi. A statistical significance was found between the groups presented in (A), with the group receiving the highest dose of 103 TCID50 losing the most weight. The group receiving the second highest infectious dose (102 TCID50) lost statistically less than the 103 TCID50 group but statistically more weight than the 2 groups receiving the two lowest infectious doses. (B-E) A statistically significance difference was found between the group receiving the lowest dose (100 TCID50) and all other groups. Multiple t tests comparing groups directly were used to analyze significance. Note: blue circles, 100 TCID50 dose; red square, 101 TCID50 dose; green triangle, 102 TCID50 dose; purple triangle, 103 TCID50 dose.

