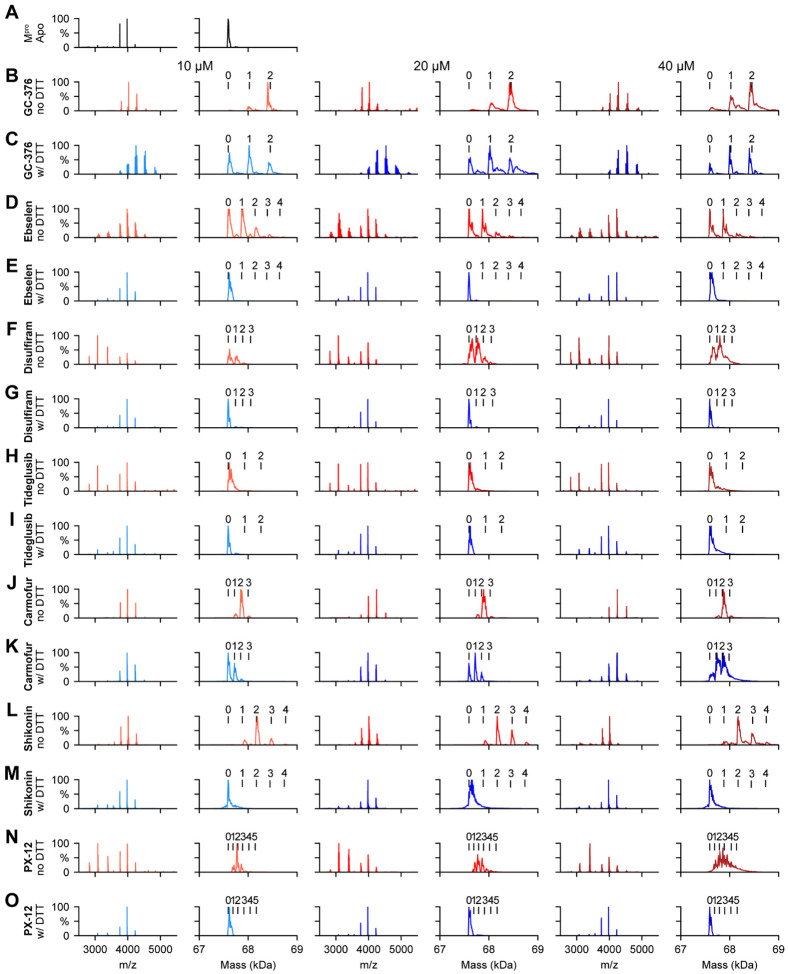
Figure 5.
Native MS binding assay of SARS-CoV-2 Mpro to different protease inhibitors investigated in this study. The native mass spectra (columns 1, 3, and 5) and deconvolved mass distributions (columns 2, 4, and 6) of SARS-CoV-2 MPro without added compound (A) and with added GC376 (B and C), ebselen (D and E), disulfiram (F and G), tideglusib (H and I), carmofur (J and K), shikonin (L and M), and PX-12 (N and O). Spectra are shown without DTT (B, D, F, H, J, L, and N) and with 4 mM DTT (C, E, G, I, K, M, and O) and for the drug concentration of 10 μM (columns 1 and 2), 20 μM (columns 3 and 4), and 40 μM (columns 5 and 6). Dimer, one drug bound dimer, two-drug bound dimer, three-drug bound dimer, four-drug bound dimer, and five-drug bound dimer were labeled as 0, 1, 2, 3, 4, and 5 respectively.

