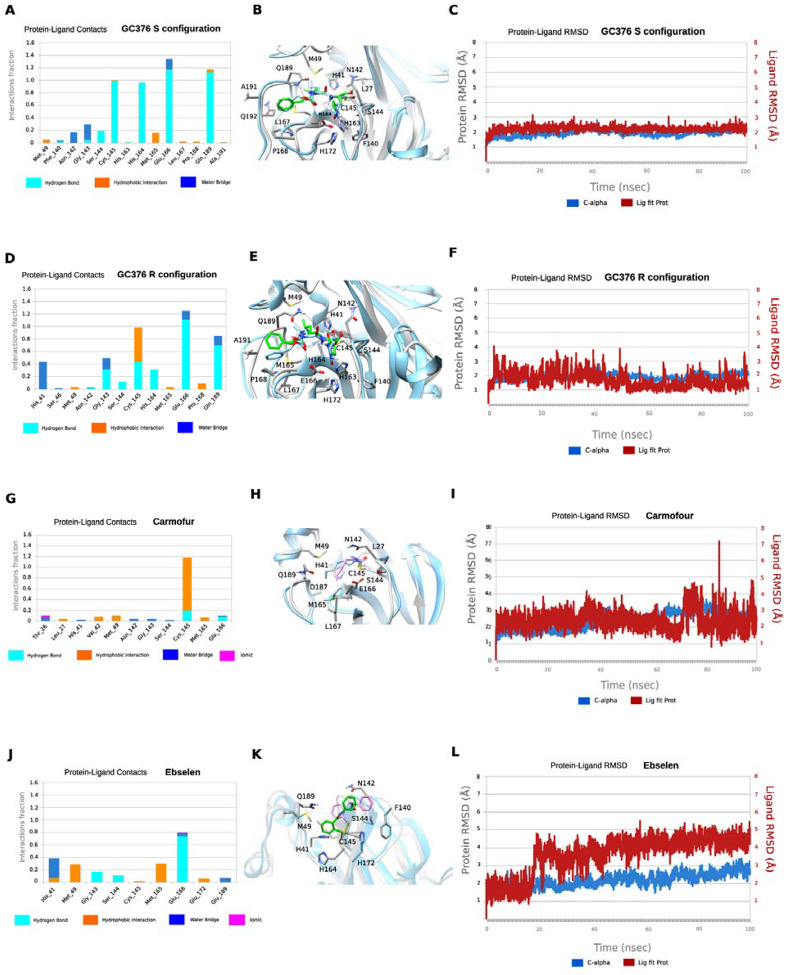
Figure 6.
MD simulations of SARS-CoV-2 Mpro with its inhibitors. In A, D, G, and J hydrogen bonding interactions bar is depicted in light blue, van der Waals in orange, water bridges in blue, and ionic interactions in magenta. Interactions are plotted from 100-ns MD simulations for the complexes between the covalently bound GC376-S, GC376-R, carmofur and ebselen inside SARS-CoV-2 Mpro. They are considered important when frequency bar is ≥ 0.2. In B, E, H, and K the last snapshots of the above mentioned 100ns-MD simulated complexes were overlaid with experimental structures with PDB IDs 6WTT for GC376-S, GC376-R and 7BUY for carmofur and a covalent docking pose for ebselen. In C, F, I, and L the RMSD plots of Cα carbons (blue diagram, left axis) and of ligand (red diagram, right axis) of the above mentioned 100ns-MD simulated complexes. The starting structures are the experimental determined structures with PDB IDs of 6WTT GC376-S, GC376-R and 7BUY for carmofur and a covalent docking poses for ebselen.

