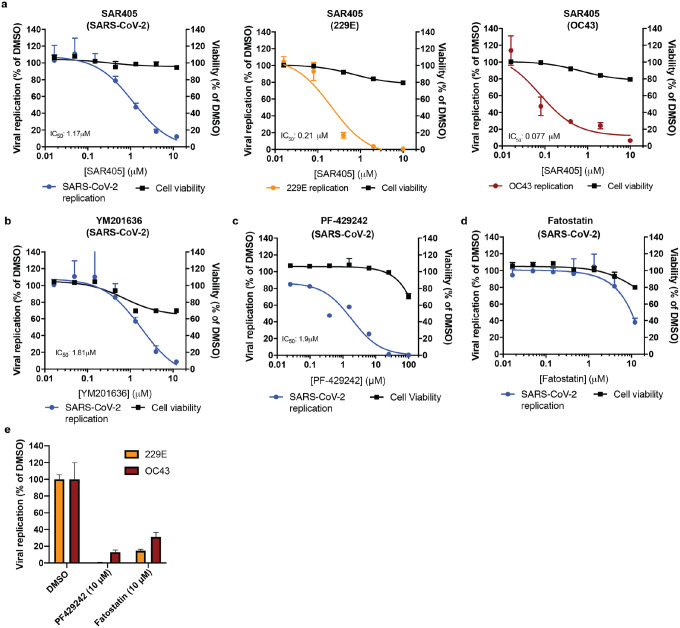
Figure 4: Pharmacological inhibition of phosphatidylinositol kinase complexes and cellular cholesterol homeostasis decreases infection with SARS-CoV-2 and common cold coronaviruses.
(a) SAR405 dose-response curves for SARS-CoV-2, HCoV-229E and HCoV-OC43 replication in Huh7.5.1 cells and for cell viability of drug treated cells. (b–d) Dose-response curves of the effect of (b) YM201636, (c) PF-429242, and (d) fatostatin to on SARS-CoV-2 replication in Huh7.5.1 cells and on cell viability of drug treated cells. (e) Quantification of 229E and OC43 replication in the presence of PF-429242 or fatostatin.
For all experiments, compounds were added simultaneously with virus. Viral RNA was quantified after 24 hpi (SARS-CoV-2) or 48hpi (229E and OC43) using RT-qPCR and normalized to RnaseP (SARS-CoV-2) or 18S RNA (229E and OC43). Values represent means ± s.e.m. relative to DMSO treated cells. For cell viability, datasets represent means ± s.d. and values are relative to DMSO treated uninfected controls. Non-linear curves were fitted with least squares regression using GraphPad Prism 8 and IC50 was determined for (a–c). All experiments were performed in 3 biological replicates.

