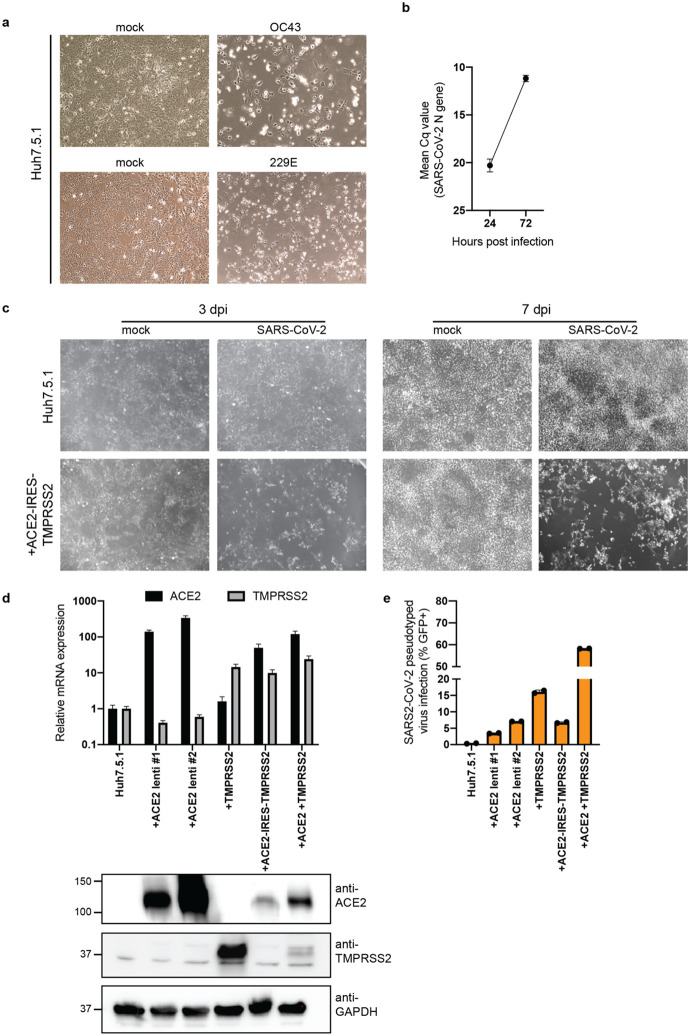
Extended Data Figure 1: Huh7.5.1 cells are susceptible to SARS-CoV-2, HCoV-OC43 and HCoV-229E.
(a) Light microscopy images of WT Huh7.5.1 infected with OC43 (7 dpi) and 229E (4 dpi). (b) Quantification of SARS-CoV-2 RNA in WT Huh7.5.1 cells at 24 and 72 hpi by RT-qPCR. Cq values represent mean ± s.e.m. from 3 biological replicates. (c) Light microscopy images of SARS-CoV-2 infected WT Huh7.5.1 cells or Huh7.5.1 cells expressing ACE2-IRES-TMPRSS2 at 3 and 7 dpi. (d) Quantification of ACE2 and TMPRSS2 expression in WT and lentivirally transduced Huh7.5.1 cells by RT-qPCR and Western blot. mRNA levels are displayed as mean ± s.e.m. from two independent harvests and are relative to expression in WT cells. Anti-ACE2 and anti-TMPRSS2 antibodies were used to detect protein levels in WT and overexpression cells. GAPDH was used as loading control. Molecular weight markers are indicated on the left. (e) Quantification of infection with pseudotyped lentivirus bearing SARS-CoV-2 spike and expressing a GFP by flow cytometry. Values are from two biological samples and are displayed as means ± s.d.

