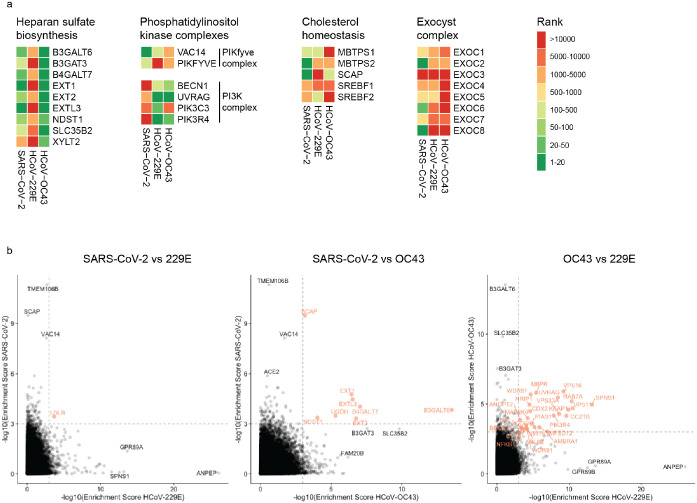
Extended Data Figure 2: Comparison of CRISPR screens reveals common and distinct host factors across SARS-CoV-2, 229E and OC43.
(a) CRISPR screen ranking of genes, which are part of specific cellular pathway or complexes, across the three CRISPR screens. (b) Pairwise comparisons of gene enrichments between two CRISPR screens. Dotted lines indicate −log10(Enrichment score) > 3. Genes that scored above the threshold in both screens, are highlighted in red.

