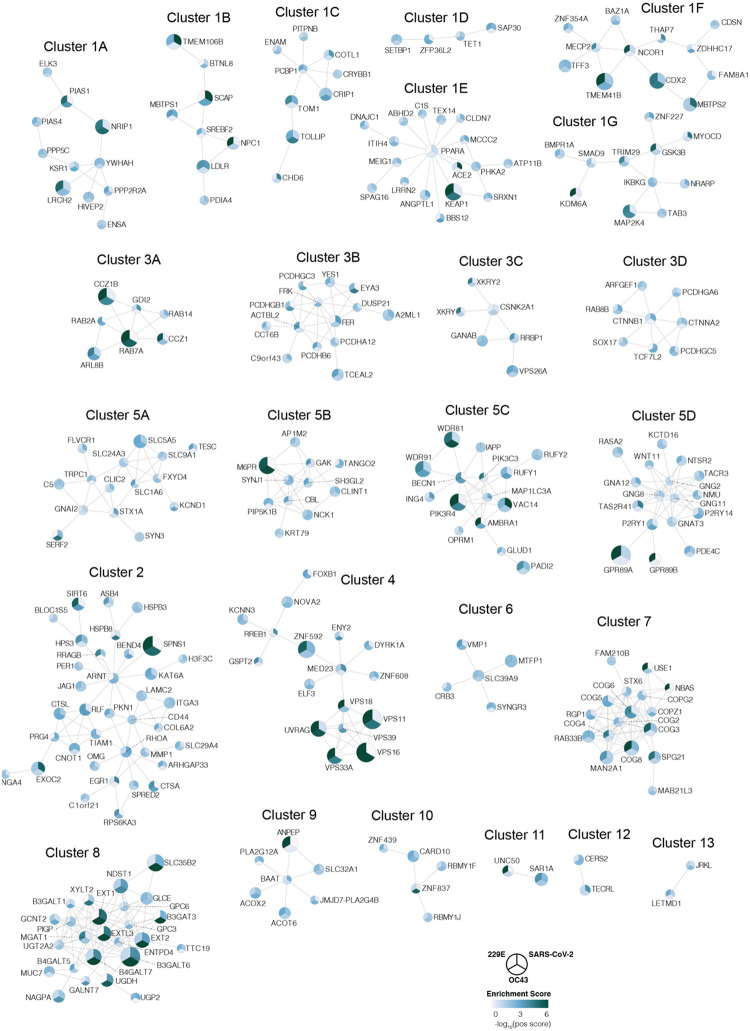
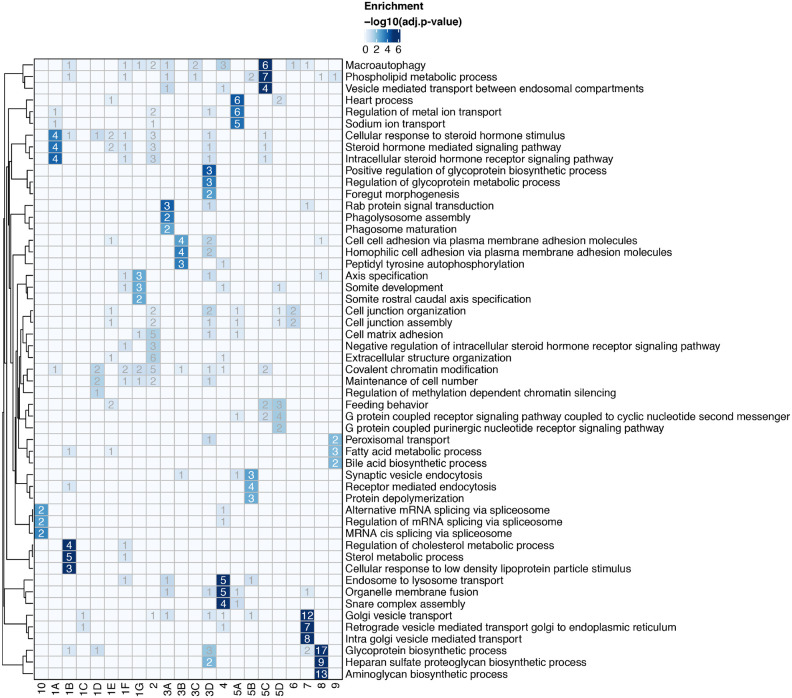
Extended Data Figure 3: Network propagation of CRISPR screen hits reveals functional clusters with distinct biological functions.
(a) Biological subclusters from network propagation. Cluster number refers to the enrichment analysis of biological processes for each cluster, displayed in Extended Data Fig. 3b. Circle size represents p-value from integrative network propagation permutation test (gene-wise multiplication across datasets, see Methods). The original positive enrichment score of a gene in each CRISPR screen is indicated by color scale within the circle. (b) Gene ontology (GO) enrichment analysis was performed on each subcluster from the network propagation. P values were calculated by hypergeometric test and a false-discovery rate was used to account for multiple hypothesis testing. The entire set of enriched biological processes for each subcluster is listed in Supplementary Table 2.


