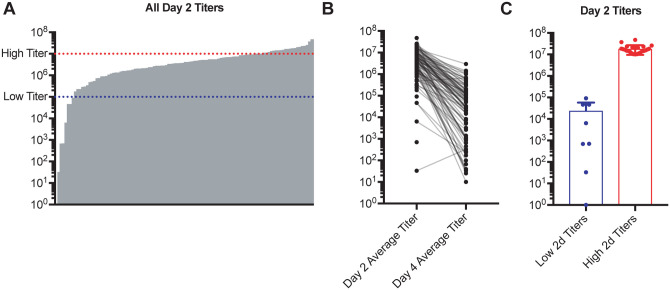
Figure 1. SARS-CoV MA15 infection of genetically diverse mice results in a variety of viral load trajectories.
Age-matched female CC-RIX were infected intranasally with SARS-CoV MA15. (A) Average viral loads in the lung at day 2 post-infection are shown for each CC-RIX line. Red dotted line indicates titers above 107 PFU, and blue dotted line indicates viral titers below 105 PFU. (B) Average viral loads in the lung at day 2 post-infection and at day 4 post-infection for each CC-RIX line. (C) The day 2 post-infection average lung viral loads are shown for selected CC-RIX lines are with extreme phenotypes: low or high viral titers. Lines with an average lung viral load of less than 105 at day 2 post-infection (N=8) were considered to be “low titer”, and lines with an average lung viral load of greater than 107 at day 2 post-infection (N=24) were considered to be “high titer” for further analysis.

