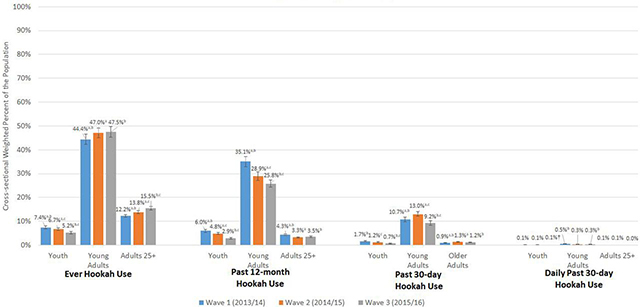
Figure 1:
Cross-sectional weighted percent of ever, P12M, P30D and daily P30D hookah use among youth, young adults and adults 25+ in W1, W2 and W3 of the Population Assessment of Tobacco and Health (PATH) Study. Abbreviations: P12M = past 12-month; P30D = past 30-day; W1 = Wave 1; W2 = Wave 2; W3 = Wave 3 W1/W2/W3 ever hookah use unweighted Ns: youth (ages 12–17) = 1,005/799/597; young adults (ages 18–24) = 5,061/4,370/4,144; adults 25+ (ages 25 and older) = 5,561/5,430/5,776W1/W2/W3 P12M hookah use unweighted Ns: youth = 815/584/344; young adults = 3,665/2,726/2,357; adults 25+ = 1,899/1,341/1,427W1/W2/W3 P30D hookah use unweighted Ns: youth = 226/153/72; young adults = 1,261/1,244/867; adults 25+ = 459/530/473W1/W2/W3 Daily P30D hookah use unweighted Ns: youth = 14/15/7; young adults = 61/37/28; adults 25+ = 29/27/16 X-axis shows four categories of hookah use (ever, P12M, P30D, and daily P30D). Y-axis shows weighted percentages of W1, W2, and W3 users. Sample analyzed includes all W1, W2, and W3 respondents at each wave. All respondents with data at one wave are included in the sample for that wave’s estimate and do not need to have complete data at all three waves. The PATH Study cross-sectional (W1) or single-wave weights (W2 and W3) were used to calculate estimates at each wave. Ever hookah use is defined as having ever used a Hookah, even once or twice in lifetime. P12M hookah use is defined as any hookah use within the past 12 months. P30D hookah use is defined as any hookah use within the past 30 days. Daily P30D hookah use is defined as use of hookah on all 30 of the past 30 days. All use definitions refer to any use that includes exclusive or polytobacco use of hookah. a denotes significant difference at p<0.0167 (Bonferroni corrected for three comparisons) between W1 and W2 b denotes significant difference at p<0.0167 (Bonferroni corrected for three comparisons) between W1 and W3 c denotes significant difference at p<0.0167 (Bonferroni corrected for three comparisons) between W2 and W3 The logit-transformation method was used to calculate the 95% confidence intervals. † Estimate should be interpreted with caution because it has low statistical precision. It is based on a denominator sample size of less than 50, or the coefficient of variation of the estimate or its complement is larger than 30%. Analyses were run on the W1, W2, and W3 Public Use Files (https://doi.org/10.3886/ICPSR36498.v8).

