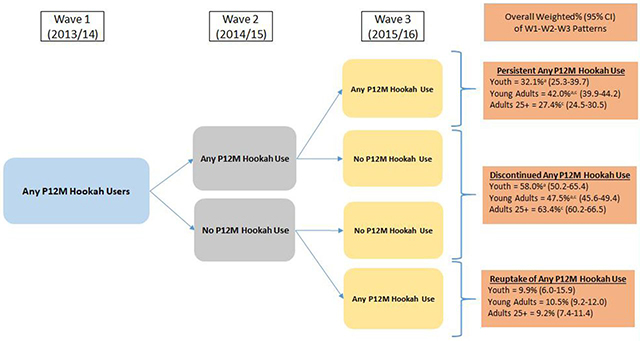
Figure 2:
Patterns of W1-W2-W3 persistent any P12M hookah use, discontinued any P12M hookah use and reuptake of any P12M hookah use among W1 any P12M hookah users. Abbreviations: W1 = Wave 1; W2 = Wave 2; W3 = Wave 3; P12M = past 12-month; CI = confidence interval Wave 1 any P12M hookah use weighted percentages (95% CI) out of total U.S. population: youth (ages 12–17) = 5.9% (5.3–6.5); young adults (ages 18–24) = 35.2% (33.0–37.5); adults 25+ (ages 25 and older) = 4.2% (3.9–4.5) Analysis included W1 youth, young adults, and adults 25+ P12M Hookah users with data at all three waves. Respondent age was calculated based on age at W1. W3 longitudinal (all-waves) weights were used to calculate estimates. These rates vary slightly from those reported in Figure 1 or Supplemental Table 1 because this analytic sample in Figure 2 includes only those with data at each of the three waves to examine weighted longitudinal use and non-use pathways. Any P12M hookah use was defined as any hookah use within the past 12 months. Respondent could be missing data on other P12M tobacco product use and still be categorized into the following three groups:1) Persistent any P12M hookah use: Defined as exclusive or hookah polytobacco use at W2 and W3.2) Discontinued any P12M hookah use: Defined as any non-hookah use or no tobacco use at either W2 and W3 or just W3.3) Reuptake of any P12M hookah use: Defined as discontinued hookah use at W2 and any hookah use at W3. a denotes significant difference at p<0.0167 (Bonferroni corrected for three comparisons) between youth and young adults b denotes significant difference at p<0.0167 (Bonferroni corrected for three comparisons) between youth and adults 25+ c denotes significant difference at p<0.0167 (Bonferroni corrected for three comparisons) between young adults and adults 25+ The logit-transformation method was used to calculate the 95% CIs. Analyses were run on the W1, W2, and W3 Public Use Files (https://doi.org/10.3886/ICPSR36498.v8).

