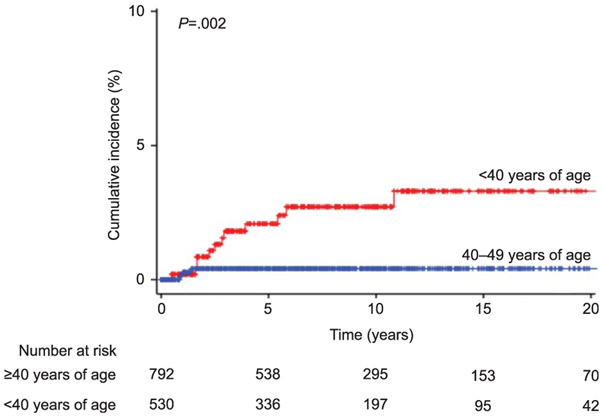
Fig. 3.
Cumulative incidence curves of subsequent ovarian cancer. Y-axis is truncated to 0–10%. Log-rank test for P values. Cumulative incidences for subsequent ovarian cancer are shown based on patient age at endometrial cancer diagnosis.
Matsuo. Ovarian Cancer After Ovarian Conservation. Obstet Gynecol 2017.

