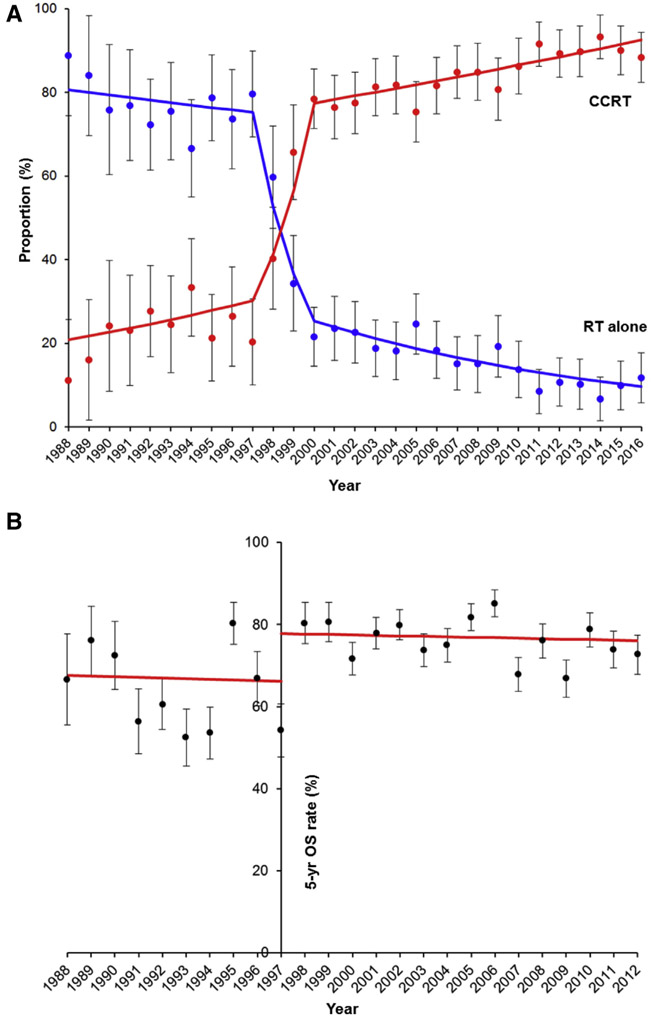
FIGURE 2. Populational trends and outcomes for concurrent chemo-radiotherapy.
A, Proportional distribution of concurrent chemo-radiotherapy (CCRT) and radiotherapy alone (RT alone) between 1988 and 2016 is shown. APC for 1988–1997 was 4.2 (95% CI, −3.3 to 12.4, P = .267); APC for 1997–2000 was 36.8 (95% CI, –0.3 to 87.6; P = .052); and APC for 2000–2016 was 1.1 (95% CI, 0.7–1.5; P < .001). B, Interrupted time-series for 5-year overall survival rate (5-yr OS rate) per population before and after 1997. The APC for 1988–1997 was −0.3 (95% CI, −5.0 to 4.8; P = .909), and APC for 1997–2012 was −0.1 (95% CI, −1.2 to 1.0, P = .776). Dots represent observed value with 95% CI. Bars represent modeled value. APC, annual percent change; CI, confidence interval.

