
FIGURE 4. Forest plots for overall survival (PS-IPTW model).
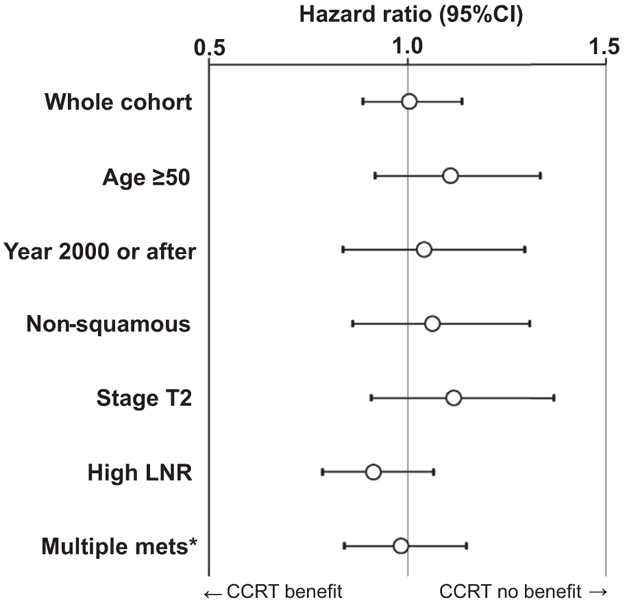
Association of postoperative radiotherapy type (CCRT vs RT) and overall survival was assessed with Cox proportional hazard regression test in the PS-IPTW model. Circles represent HR, and bars represent 95% CI. *Multiple pelvic lymph node metastases. CCRT, concurrent chemo-radiotherapy; CI, confidence interval; HR, hazard ratio; LNR, lymph node ratio; PS-IPTW, propensity score inverse probability of treatment weighting; RT, radiotherapy alone.