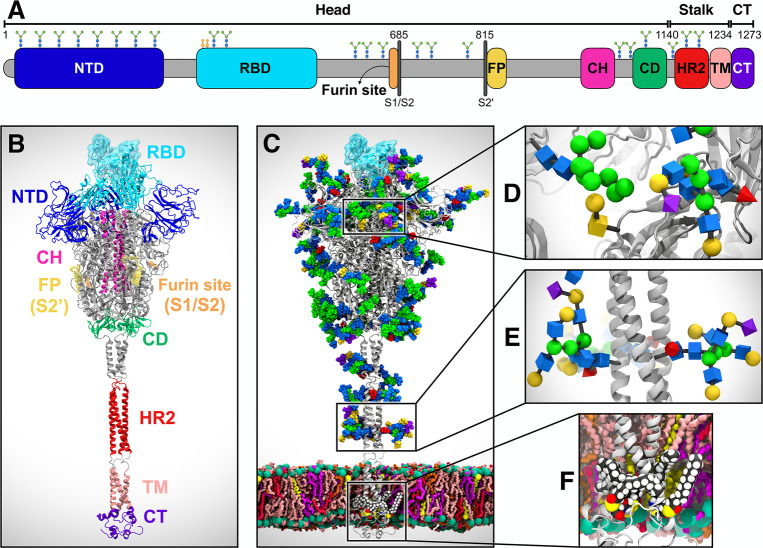
Figure 1.
System overview. (A) Schematic of the full-length SARS-CoV-2 S protein primary structure colored by domain: N-terminal domain (NTD, 16–291), receptor binding domain (RBD, 330–530), furin cleavage site (S1/S2), fusion peptide (FP, 817–834), central helix (CH, 987–1034), connecting domain (CD, 1080–1135), heptad repeat 2 (HR2, 1163–1210) domain, transmembrane domain (TM, 1214–1234), and cytoplasmic tail (CT, 1235–1273). Representative icons for N-glycans (blue and green) and O-glycan (yellow) are also depicted according to their position in the sequence. (B) Assembly of the head, stalk, and CT domains into the full-length model of the S protein in the open state. (C) Glycosylated and palmitoylated full-length model of the S protein in the open state embedded in a lipid bilayer mimicking the composition of the endoplasmic reticulum-Golgi intermediate compartment. Protein is depicted with gray cartoons, where the RBD in the “up” state is highlighted with a transparent cyan surface. N-/O-glycans are shown in Van der Waals representation, where GlcNAc is colored in blue, mannose in green, fucose in red, galactose in yellow, and sialic acid in purple. Color code used for lipid tails (licorice presentation): POPC (pink), POPE (purple), POPI (orange), POPS (red), cholesterol (yellow). P atoms of the lipid heads are shown with green spheres. Cholesterol’s O3 atoms are shown with yellow spheres. (D) Magnified view of the S protein head glycosylation, where glycans are depicted using the Symbol Nomenclature for Glycans (SNFG). (E) Magnified view of the S protein stalk glycosylation. (F) Magnified view of the S protein S-palmitoylation within CT.

