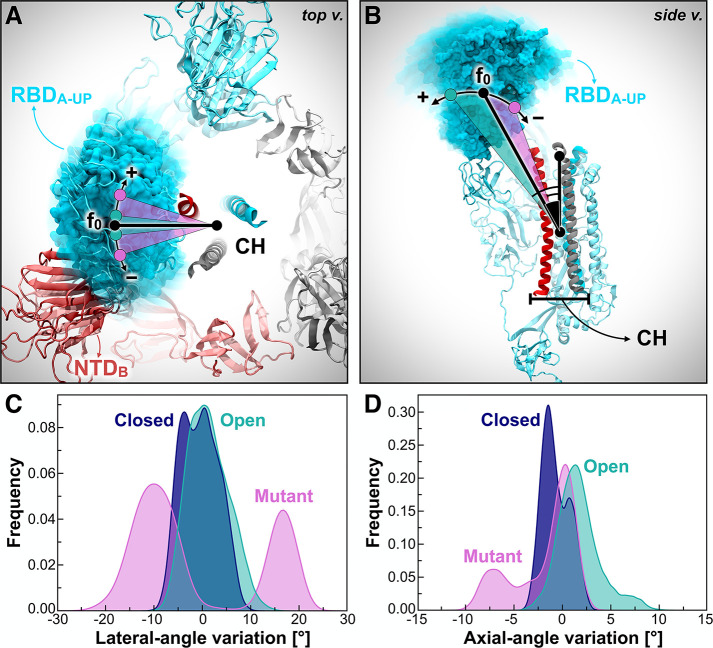
Figure 3.
RBD-A lateral- and axial-angle fluctuations. (A, B) RBD-A lateral-angle (A) and axial-angle (B), where chains A, B, and C of the spike are represented as cartoons colored in cyan, red, and gray, respectively. Positive and negative variations with respect to the initial frame (0) are indicated with the “+” and “–” symbols, respectively. N-/O-Glycans and some structural domains of the spike are omitted for clarity. (C, D) Distributions of RBD-A lateral-angle (C) and axial-angle (D) fluctuations along the trajectories (across all replicas) in Closed (blue), Open (teal), and Mutant (magenta). Angle variations were calculated with respect to their value at frame 0. Frequencies have been normalized within the respective data sets.

