Figure 7.
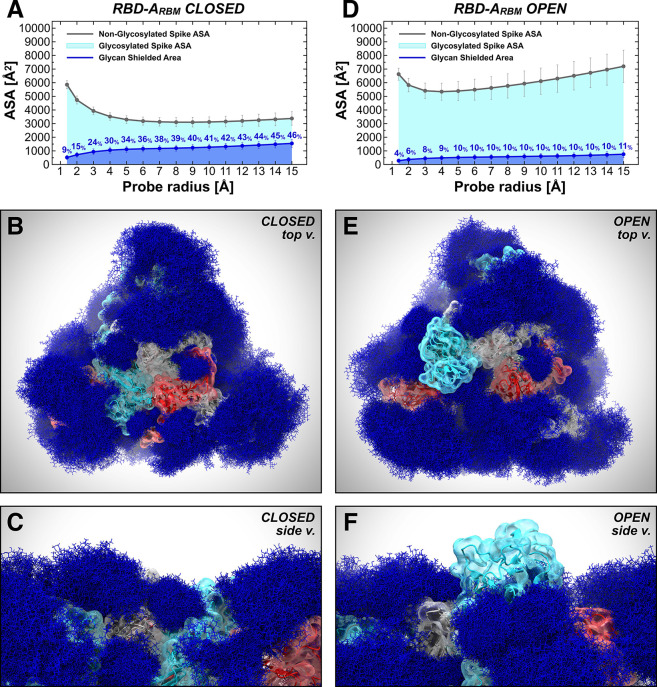
Glycan shield of the RBD ACE2-interacting region. The accessible surface area of the RBM-A and the area shielded by neighboring glycans in the Closed (A) and Open (D) systems are plotted at multiple probe radii from 1.4 (water molecule) to 15 Å (antibody-sized molecule). The values have been averaged across replicas and are reported with standard deviation. In blue is the area of the RBM-A covered by the glycans (rounded % values are reported), whereas the gray line is the accessible area in the absence of glycans. Highlighted in cyan is the RBM-A area that remains accessible in the presence of glycans, which is also graphically depicted on the structure in the panels located below the plots. (B–F) Molecular representation of Closed and Open systems from top (B and E, respectively) and side (C and F, respectively) views. Glycans (blue lines) are represented at several frames equally interspersed along the trajectories (300 frames along 0.55 ns for Closed and 1.0 μs for Open), while the protein is shown with colored cartoons and a transparent surface (cyan, red, and gray for chains A, B, and C, respectively). Importantly, in panels E and F, RBD within chain A (cyan) is in the “up” conformation and emerges from the glycan shield.

