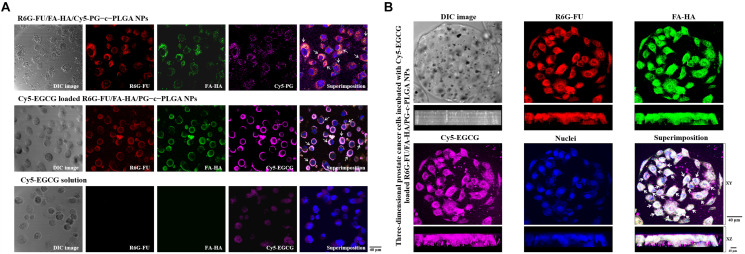
FIGURE 4.
(A) Confocal images of prostate cancer cells showing cellular distribution of the NP preparations. (A) Treatment with only R6G-FU/FA-HA/Cy5-PG–c–PLGA NPs or Cy5-epigallocatechin gallate (EGCG)-loaded R6G-FU/FA-HA/PG–c–PLGA NPs vs. Cy5-EGCG. (B) Three-dimensional analysis of fluorescent PC3 cells adhered to Matrigel-coated microcarriers incubated with fluorescent Cy5-EGCG-loaded R6G-FU/FA-HA/PG–c–PLGA NPs.

