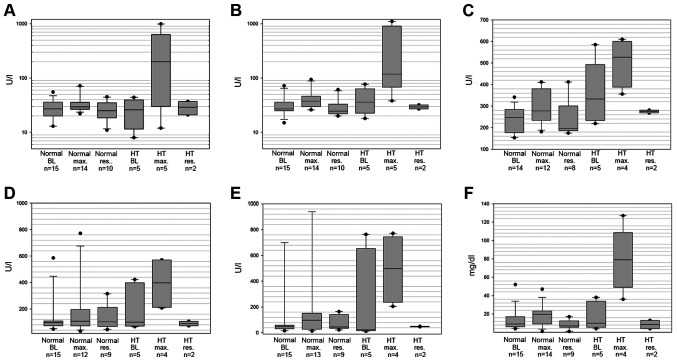
Figure 1.
Box plot displaying laboratory values of (A) ALT, (B) AST, (C) LDH, (D) AP, (E) γ-GT and (F) bilirubin. γ-GT was elevated and grade >3 at BL for 2 patients with HT, of whom 1 patient exhibited a significant increase in AST and ALT from normal to grade 3 and 4 values, without further alteration of γ-GT; the other patient exhibited a minor increase in AST, ALT, AP and γ-GT levels. Median, interquartile range, 95% confidence interval, maximum and minimum levels measured at BL, levels at maximum elevation (max.) and resolution of toxicity (res.) are shown for patients with HT and those without HT (normal). HT, hepatic toxicity; ALT, alanine aminotransferase; AST, aspartate aminotransferase; LDH, lactate dehydrogenase; AP, alkaline phosphatase; γ-GT, γ-glutamyltransferase; BL, baseline.

