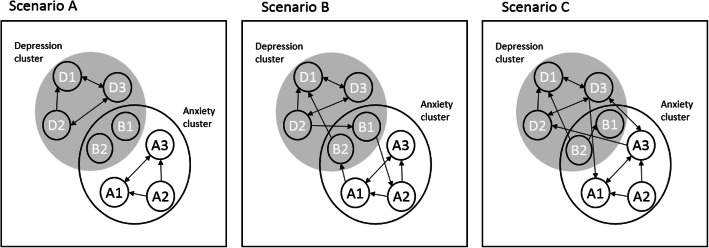
Fig. 1.
Network account of comorbidity. The small circles represent different symptoms, and the edges between them represent uni- or bidirectional associations over time. The larger circles represent clusters of symptoms of different diagnostic syndromes. The two symptoms (i.e., B1 and B2), which are part of both larger circles, are overlapping symptoms. These are common to both diagnostic syndromes. In scenario A, the overlapping symptoms are not activated as part of either diagnostic syndrome; therefore, no comorbidity between depression and anxiety arises. In scenario B, overlapping symptoms function as bridge symptoms between both diagnostic syndromes, resulting in comorbidity. In scenario C, comorbidity arises due to non-overlapping symptoms (i.e., D3 and A1) functioning as bridges between diagnostic syndromes

