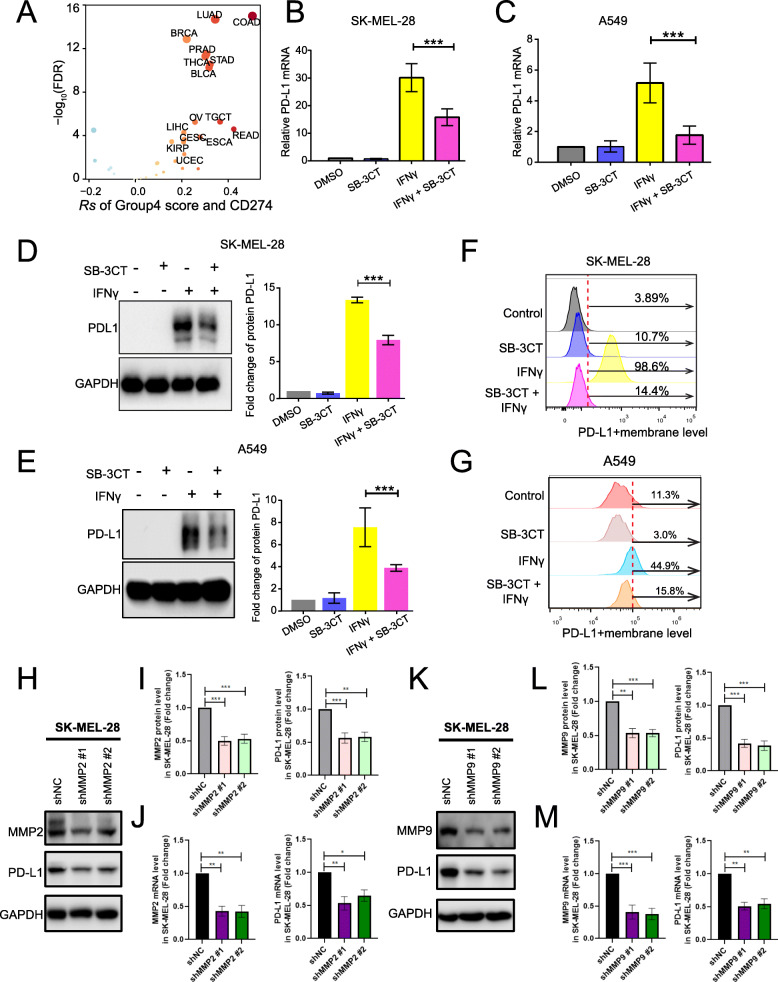
Fig. 4.
Downregulation of MMP2/9 by SB-3CT treatment reduced PD-L1 expression. a Spearman’s correlation of group4 score and PD-L1 mRNA expression across 33 cancer types. b–g Evaluation of PD-L1 expression derived from SK-MEL-28 melanoma cell lines and A549 lung cancer cell lines treated with DMSO, SB-3CT (25 μM), IFNγ (200 ng/mL), and IFNγ/SB-3CT in combination for 24 h. b, c PD-L1 expression by RT-PCR in b SK-MEL-28 melanoma cell lines and c A549 lung cancer cell lines. d, e Western blot (left panel: representative images, right panel: quantification) of PD-L1 protein levels in d SK-MEL-28 and e A549. f, g Flow cytometry of PD-L1+ membrane level in f SK-MEL-28 and g A549. h–m PD-L1 expression of SK-MEL-28 melanoma cell line transfected with shMMP2 (h–j) and shMMP9 (k–m) or the scrambled negative control shRNA (shNC). Western blot (h, k) quantification of MMP2, MMP9, and PD-L1 protein expression (i, l), and RT-PCR analysis of MMP2, MMP9, and PD-L1 mRNA expression (j, m)

