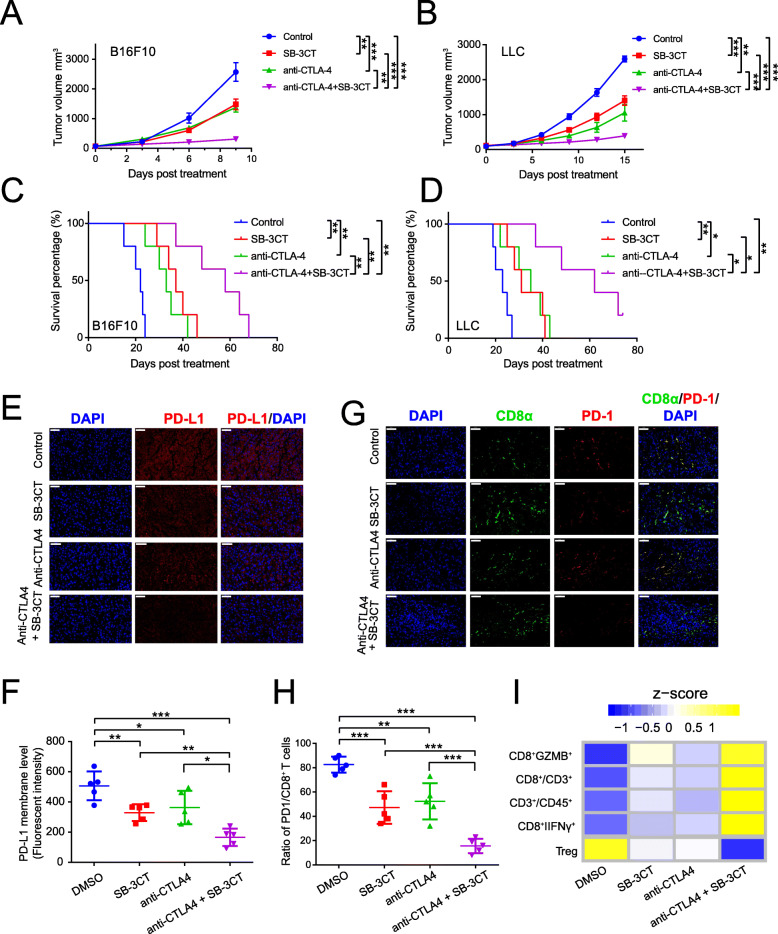
Fig. 6.
Synergistic therapeutic effect of SB-3CT treatment combined with CTLA-4 blockade. Tumor volumes of a B16F10 or b LLC tumor-bearing C57/BL6 mice treated with isotype, SB-3CT, anti-CTLA-4, or combination strategy. Kaplan–Meier survival analysis of c B16F10 or d LLC tumor-bearing C57/BL6 mice treated with isotype, SB-3CT, anti-CTLA-4, or combination strategy. e–i Immune features in B16F10 tumor-bearing C57/BL6 mice treated with isotype, SB-3CT, anti-CTLA-4, or combination strategy. e Fluorescence expression and f quantification of PD-L1 expression in tumor. g Fluorescence expression and h quantification of PD1+CD8+ T cells in tumor. i Heatmap represents Z-score normalized percentage of immune cell populations. Sample size per group in one experiment is 5. Error bars represent s.d. of individual mice per group in one experiment. NS, p > 0.05, *p < 0.05, **p < 0.01, and ***p < 0.001, as determined by a, b two-way ANOVA, c, d two-sided log-rank test, and f, h one-way ANOVA and Dunnett’s multiple comparison test

