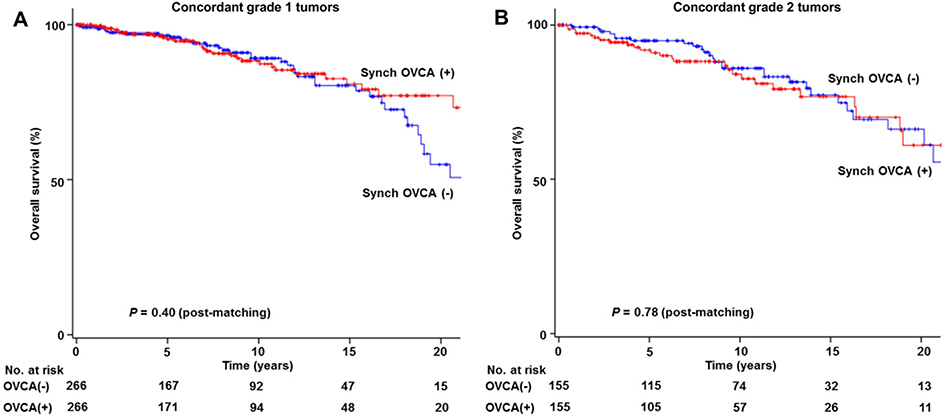
Fig. 3. Survival curves for sensitivity analysis.
Log-rank test for P-values. Overall survival is shown for stage I endometrioid endometrial cancer with synchronous stage I endometrioid ovarian cancer (red lines) compared to stage I endometrioid endometrial cancer without synchronous ovarian cancer (blue lines) based on propensity score matching status: panel A, concordant grade 1 tumors at the two cancer sites: and panel B, concordant grade 2 tumors at the two cancer sites. Abbreviations: Synch OVCA, synchronous stage I endometrioid ovarian cancer.

