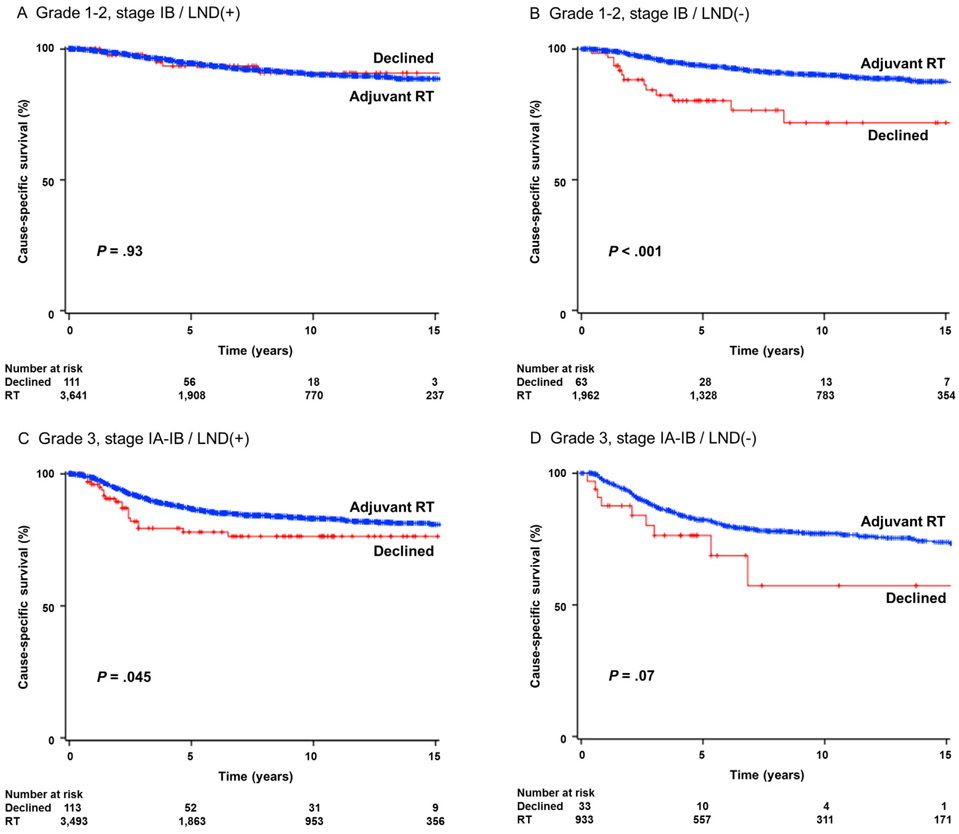
FIGURE 2.
Survival curves for cause-specific survival. Log-rank test for P-value. Survival curves were constructed per the Kaplan-Meier method for cause-specific survival for grade 1-2 stage IB disease with lymphadenectomy (panel A), grade 1-2 stage IB disease without lymphadenectomy (panel B), grade 3 stage IA-IB disease with lymphadenectomy (panel C), and grade 3 stage IA-IB without lymphadenectomy (panel D). LND, pelvic lymphadenectomy

