
Fig. 6.
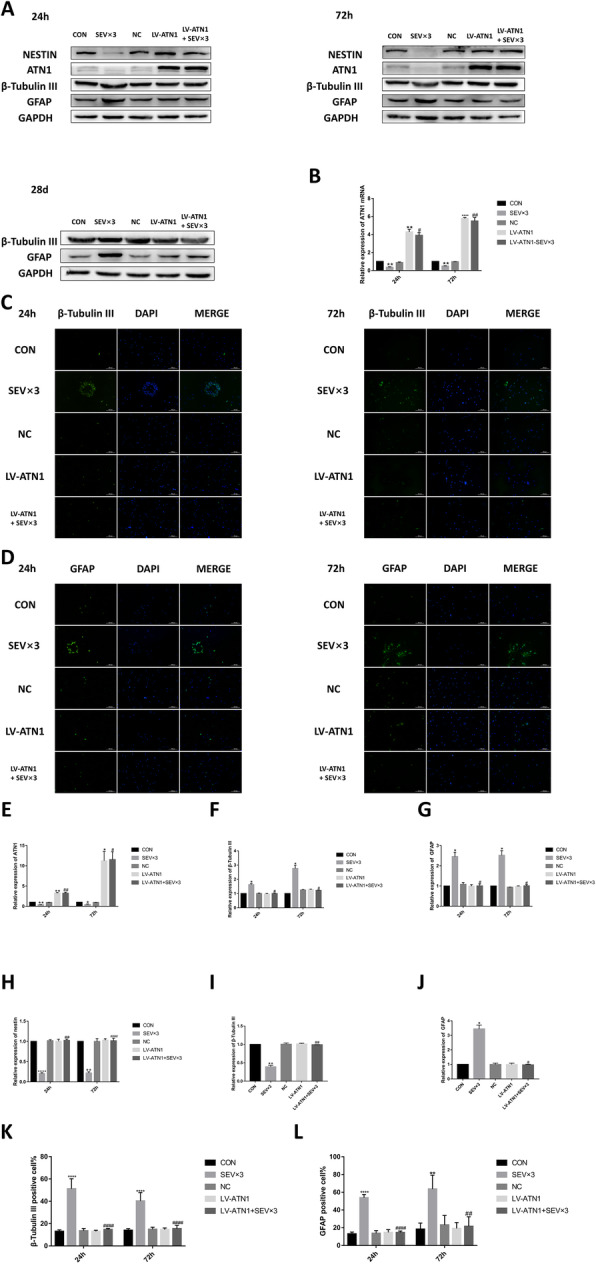
ATN1 overexpression alleviated sevoflurane-induced early NSC differentiation. a Western blotting images of β-tubulin III, GFAP, nestin, and atrophin 1(ATN1). b RT-qPCR analysis of ATN1 mRNA expression. c Immunofluorescence images of β-tubulin III (green). Scale bar = 100 μm. d Immunofluorescence images of GFAP (green). Scale bar = 100 μm. e Quantitative analysis of ATN1. f Quantitative analysis of β-tubulin III. g Quantitative analysis of GFAP. h Quantitative analysis of nestin. i Quantitative analysis of β-tubulin III on day 28. j Quantitative analysis of GFAP on day 28. k Quantification of β-tubulin III-positive cells. l Quantification of GFAP-positive cells