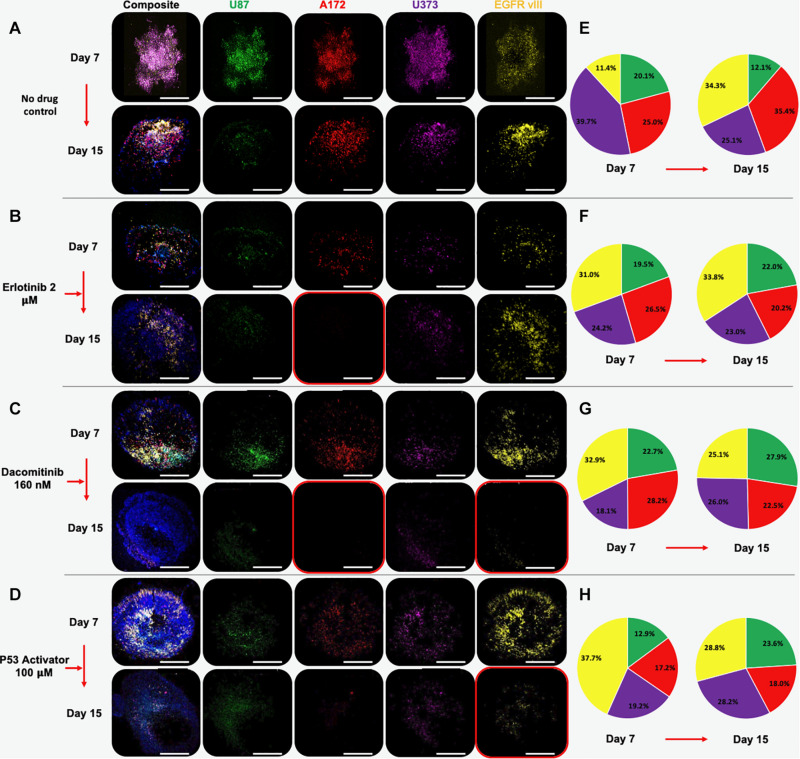
FIGURE 3.
Multi-cell type GBM organoids experience subpopulation shifts in response to therapeutic interventions. Organoids are comprised of U87 (green), A172 (red), U373 (purple), and U87 EGFR VIII (yellow) cells. Panels show composite and unmixed fluorescent channels at days 7 and 15. (A) Under no drug control condition, all cell types remain by day 15, although A172, U373, and U87 EGFR VIII cell populations outweigh U87 cells. (B) Erlotinib causes a significant decrease in the U87 and A172 population, while the EGFR vIII positive population appears to increase in number. (C) Dacomitinib causes decrease in A173 and EGFR VII populations. (D) A P53 activator causes decrease in A173 and EGFR VII populations. Images taken at day 7 and after a 7-day drug treatment on day 15. (E–H) Color-matched pie charts in which relative percentages of each GBM cell line are shown at days 7 and 15 for each condition.

