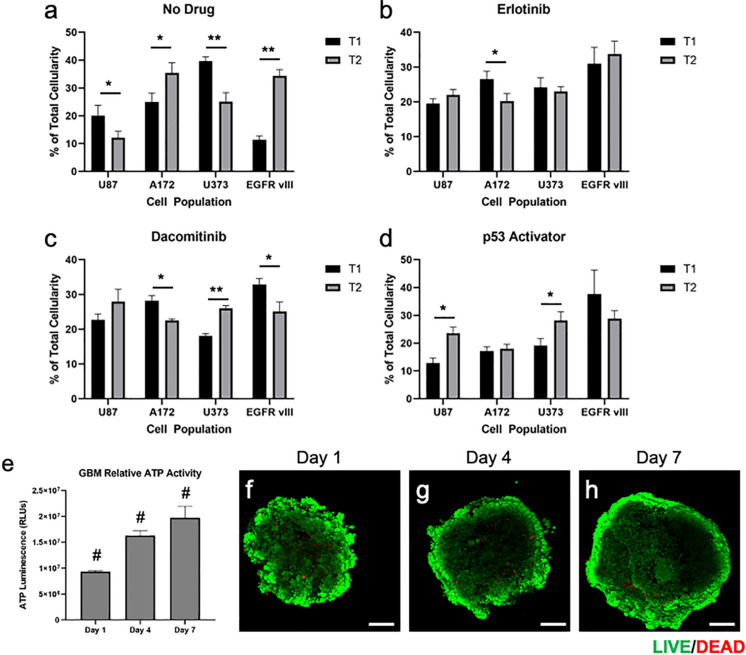
FIGURE 4.
Quantification and statistical analysis of multi-cell type GBM organoids in response treatments and baseline viability validation. (a–d) Percentage of total cellularity for each cell type is shown at T1 (7 days) and T2 (15 days) for (a) no drug, (b) erlotinib, (c) dacomitinib, and (d) the p53 activator. Drugs were administered at day 7 following the documentation at the first time point. Statistical significance: *p < 0.05; **p < 0.01. (e–h) Quantification of ATP activity over time and visualization of GBM organoid baseline viability. Multi-cell type GBM organoids were maintained in culture for 7 days following formation, during which (e) ATP was quantified on days 1, 4, and 7, showing increasing ATP activity over time. (f–h) In parallel, LIVE/DEAD staining was performed on days 1, 4, and 7, after which organoids were imaged by fluorescent confocal microscopy. Scale bars – 100 μm; Green calcein AM-stained cells – viable cells; Red ethidium homodimer-stained cells – dead cells. Statistical significance: #p < 0.001 between the 3 time points.

