
Extended Data Fig. 4. Bulk RNA-seq of ROS+ and MHC+ CNS innate immune cells.
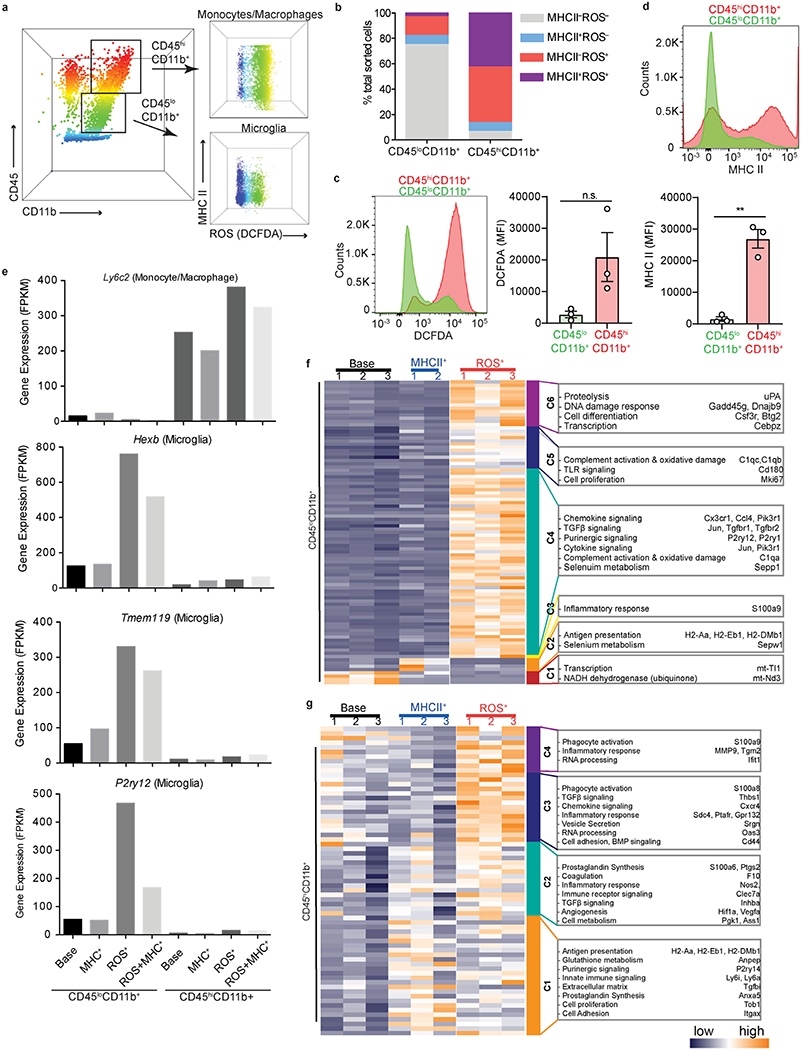
a, Representative flow cytometry plots of CD45loCD11b+ (microglia) and CD45hiCD11b+ (monocytes) cells sorted based on MHC II and ROS production (assessed via DCFDA) from EAE spinal cord. Data are representative of n = 3 independent experiments with similar results. b, Cell percentages of sorted microglia and monocytes populations. Data are from n = 3 independent experiments with 5 spinal cord EAE tissues pooled per experiment. c, d, Quantification of MFI of ROS production (assessed via DCFDA) (c) and MHC II (d) expression in CD45loCD11b+ and CD45hiCD11b+ cells. Data are from n = 3 experiments (mean ± s.e.m.) ** P = 0.0011, n.s., not significant P = 0.080 (two-tailed unpaired t-test). Each symbol represents an individual mouse. e, Gene expression (FPKM) profiles of select microglia and monocyte/macrophage markers across each sorted population. Base, MHCII−ROS− cells. f, Heat map of bulk RNA-seq cluster analysis from CD45loCD11b+ cells. Six gene clusters (C1-6) were annotated with functions for selected genes based on expression levels. g, Heat map of bulk RNA-seq cluster analysis from CD45hiCD11b+ cells. Four gene clusters (C1-4) were annotated with functions for selected genes based on expression levels. Key indicates normalized z-score expression.