
Extended Data Fig. 7. Effects of acivicin in EAE, antigen-presenting cell function and GGT1 expression.
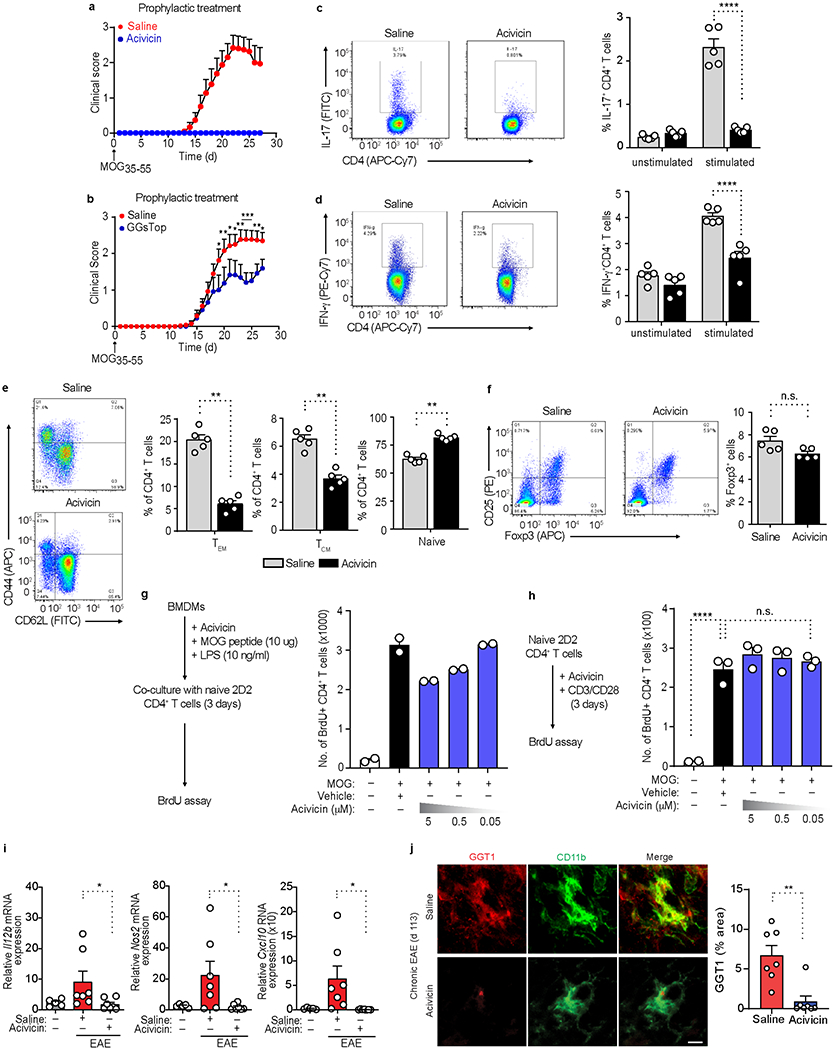
a, Clinical scores of MOG35-55 EAE mice (upward arrow) after daily prophylactic administration of acivicin (5 mg/kg, i.p.) or saline (key) starting day 0. Data are from n = 14 mice (acivicin), n = 15 mice (saline). b, Clinical scores for MOG35-55-induced EAE (upward arrow), followed by prophylactic injection of GGsTop (5 mg/kg, i.p.) or saline (key) every day beginning day 0. Data are from n = 13 mice (MOG35-55 + saline) or n = 12 mice (MOG35-55 + GGsTop). c-f, Flow cytometry analysis of splenocytes from MOG35-55-EAE mice treated with saline or acivicin for 10 days and assessed for IL-17+ or IFN-γ+ CD4+ T cells (c, d), effector memory (TEM), central memory (TCM), and naive CD4+ T cells (e), or CD25+FoxP3+ Treg cells (f). Data are from n = 5 mice per group. g, h, Flow cytometry analysis of BrdU+ 2D2 T cells activated with LPS primed BMDMs (pulsed with MOG35-55 peptide) or anti-CD3 and anti-CD28 in the presence or absence of acivicin. Data are from n = 3 independent experiments performed in technical duplicates. i. qRT-PCR analysis of gene expression from spinal cord extracts of unimmunized healthy controls and MOG35-55-EAE mice at peak disease, treated with saline or acivicin. Data are from n = 5 mice (unimmunized healthy control), n = 7 mice (EAE + saline), or n = 7 mice (EAE + acivicin). j, Confocal microscopy of spinal cord sections from NOD mice with chronic MOG35-55 EAE, treated with acivicin or saline every day starting at day 80 until day 113, showing GGT1 and CD11b immunoreactivity. Scale bar, 25 μm. Quantification of GGT1 immunoreactivity in white matter of spinal cord. Data are from n = 7 (EAE + acivicin) and n = 7 (EAE + saline) mice. Each symbol represents an individual mouse (c-f, i, j) or an individual experiment (g, h). Data are shown as means ± s.e.m. (a-j). * P < 0.05, **P < 0.01, *** P < 0.001, **** P < 0.0001; n.s., not significant, as determined by two-tailed permutation test (b), two-way ANOVA with Tukey’s multiple comparisons test (c, d), two-tailed Mann-Whitney test (e, f, i, j), or one-way ANOVA with Tukey’s multiple comparisons test (h).