
Fig. 2. Overlay of CNS innate immune cell clusters with oxidative stress core signature genes.
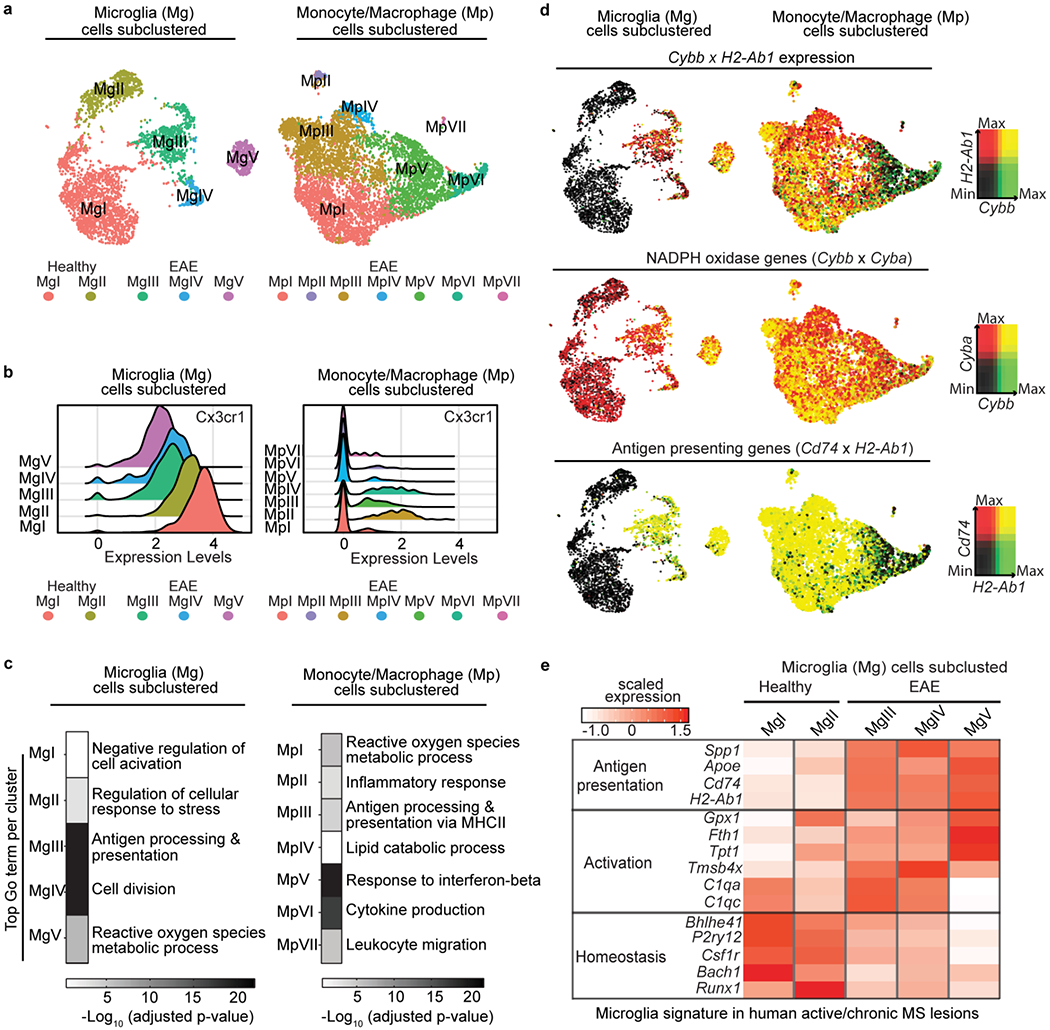
a, UMAP plots of unsupervised subclustering analysis of microglia (n = 3,033 cells from 2 healthy and 2 EAE mice) or monocyte/macrophages (n = 5,240 cells from 2 EAE mice) showing clusters numerically labeled. b, Ridge plot of Cx3cr1 gene expression levels across all microglia and monocyte/macrophage clusters. c, Heat maps of top significant GO terms for each single cell cluster (P < 0.05, accumulative hypergeometric test with Benjamini-Hochberg correction). 5 microglia clusters; n = 3,033 cells from 2 healthy and 2 EAE mice or 7 monocyte/macrophages clusters; n = 5,240 cells from 2 EAE mice. d, UMAP plots of microglia or monocyte/macrophages clusters showing single-cell gene expression overlays for Cybb and H2-Ab1(top), Cybb and Cyba (middle) or Cd74 and H2-Ab1 (bottom). Cells highly co-expressing both gene marker pairs are depicted as double+ cells in yellow (right key). Clusters from healthy and EAE mice are shown (bottom key). e, Heat map depicting comparison of Tox-seq microglia subclusters in EAE with signatures of microglia from human active/chronic MS lesions16. Average gene expression is depicted as scaled z-score expression (key).