
Fig. 3. The oxidative stress core signature in EAE.
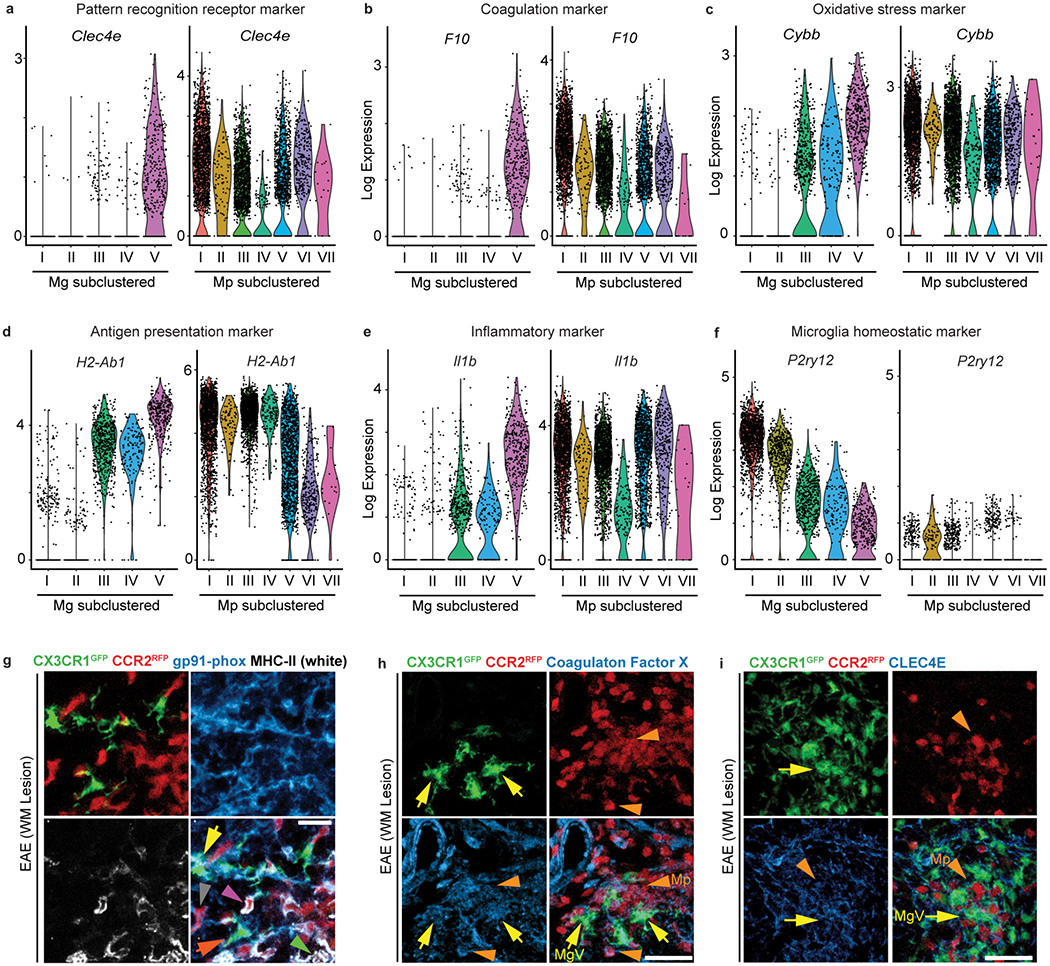
a-f, Violin plots of log expression levels of Clec4e (a), F10 (encodes coagulation factor X) (b), Cybb (encodes the NADPH oxidase subunit gp91-phox) (c), H2-Ab1 (encodes MHC II) (d), Il1b (e) and P2ry12 (f) across microglia and monocyte/macrophages subclustered single-cell populations. (a-f) Violin plots depict minima and maxima expression with points showing single cell expression levels. 5 microglia clusters; n = 3,033 cells from 2 healthy and 2 EAE mice or monocyte/macrophages clusters; n = 5,240 cells from 2 EAE mice. g, Confocal microscopy of a white matter (WM) lesion from Cx3cr1GFP/+Ccr2RFP/+ mice with MOG35-55-induced EAE, showing CX3CR1+ cells (green), CCR2+ cells (red), and immunoreactivity for the oxidative stress marker NADPH oxidase subunit gp91-phox (blue) and the antigen presentation marker MHC II (white). Data are representative of n = 4 mice; tissues were collected at onset of EAE (clinical score 1.0). Yellow arrows, gp91-phox+MHC II+ microglia; orange arrows, gp91-phox+MHC II− microglia; pink arrowhead, gp91-phox+MHC II+ monocyte/macrophages; green arrowhead, gp91-phox−MHC II+ monocyte/macrophages; grey arrowhead, gp91-phox+MHC II− monocyte/macrophages. h, i, Confocal microscopy from spinal cords of mice as in g, showing CX3CR1+ cells (green), CCR2+ cells (red), and immunoreactivity for coagulation factor X (blue) (h), or CLEC4E (blue) (i). Data are representative of n = 4 mice; tissues were collected at onset of EAE (clinical score 1.0). Arrows and arrowheads denote microglia and monocyte/macrophages, respectively. Scale bar, 50 μm (g-h).