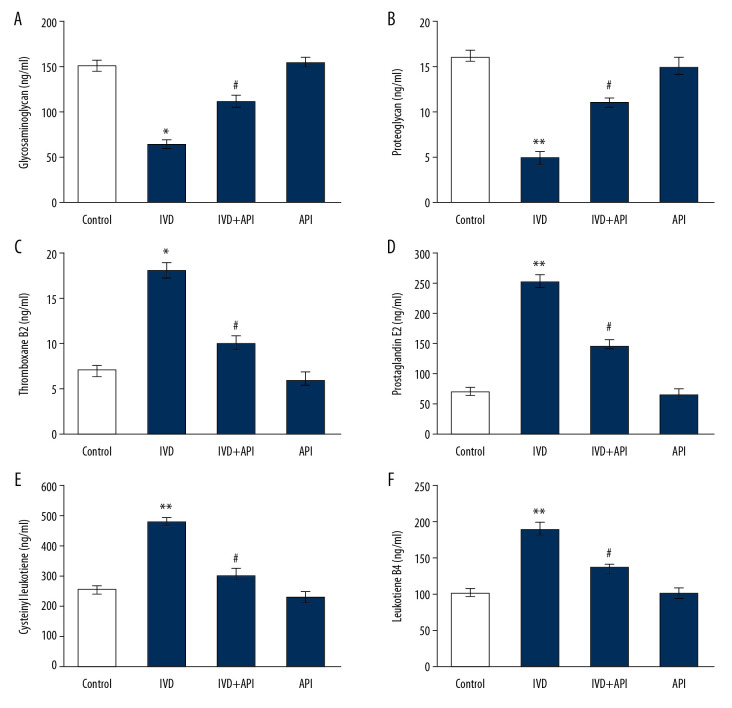
Figure 2.
(A–F) represents the proteoglycans and prostacyclin in the control and experimental group of rats. The details of the assay were given in the methodology section. Statistical significance shown as * P<0.05, ** P<0.01, compared to sham-controls, # P<0.05, IDD+apigenin-treated compared to IDD-induced rats.

