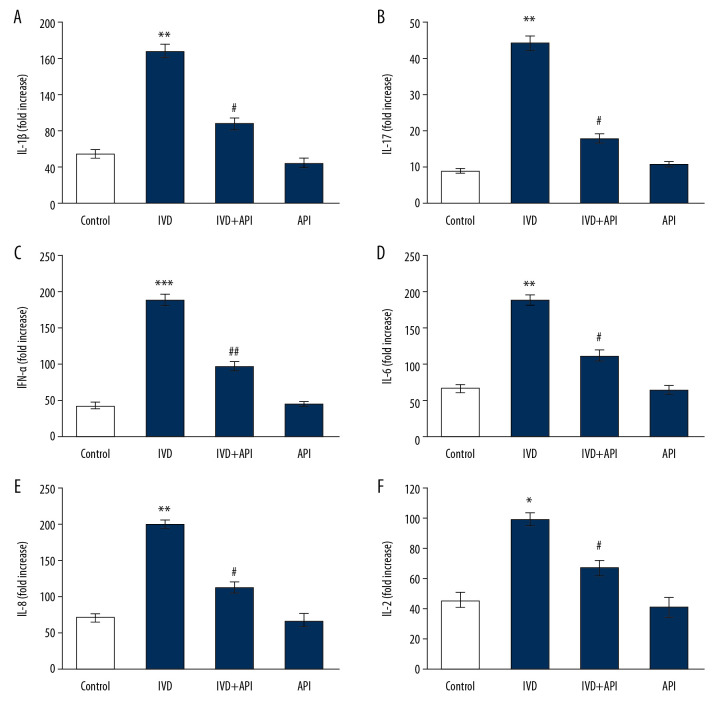
Figure 5.
(A–F) represents cytokine expression analysis of control and experimental groups of rats. The detail of the experiment is given in the methodology section. Statistical significance shown as * P<0.05, ** P<0.01, *** P<0.001 compared to sham controls, # P<0.05, ## P<0.01, IDD+apigenin-treated compared to IDD-induced rats.

