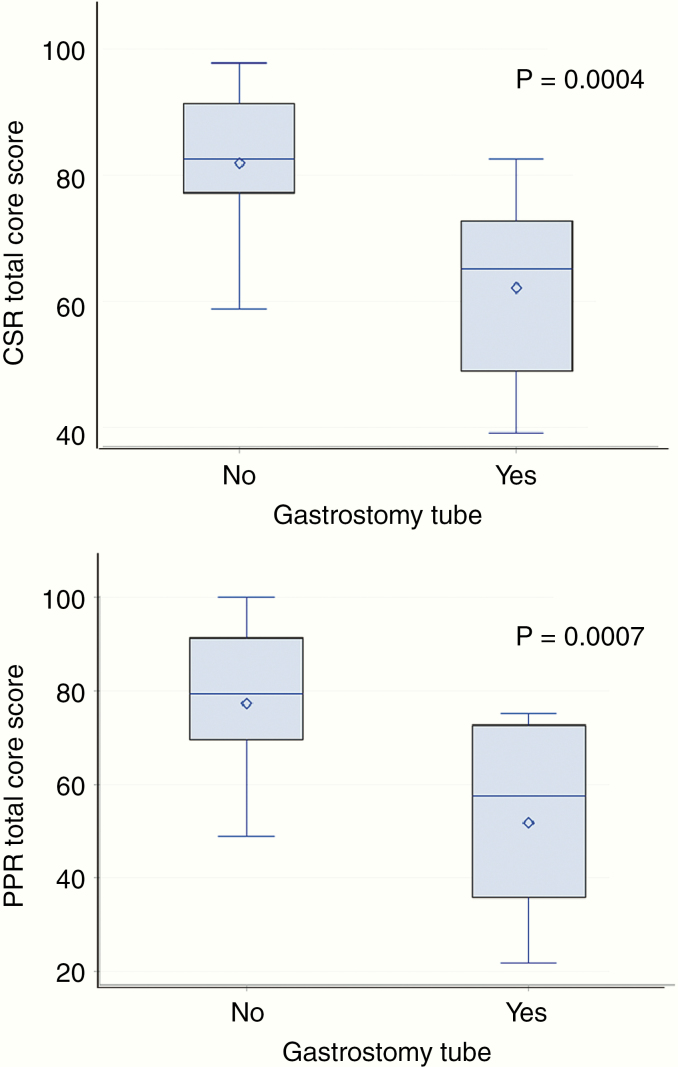
Fig. 2.
Comparison of long-term follow-up child self-reported (top) and parent proxy-reported (bottom) PedsQL total core score according to whether the patient required a gastrostomy tube at time of diagnosis or treatment. Upper and lower bars represent maximum and minimum scores, diamond is mean, horizontal line is median, shaded box is interquartile range. Scores are compared with the ANOVA method.

