Fig. 3.
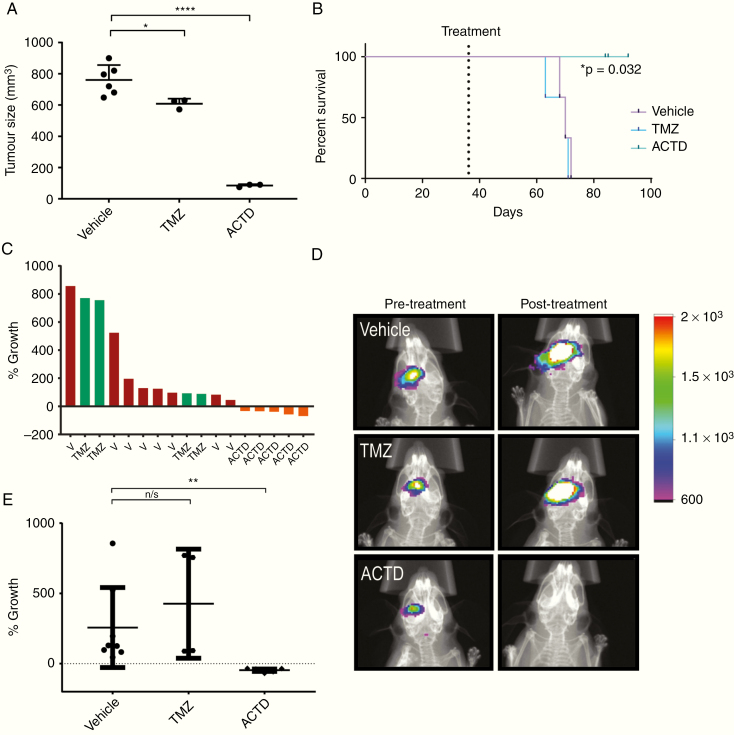
(A, B) Subcutaneous in vivo validation of ACTD in patient-derived TS9 tumors. (A) Subcutaneous tumors were excised and measured ex vivo for accuracy, data shown are the volume of vehicle-, TMZ- and ACTD-treated subcutaneous tumors as measured by calipers (mm3). Volume measurements were analyzed by one-way ANOVA and Tukey’s multiple comparisons test. Significance = *P < 0.05, **P < 0.01, ***P < 0.001, and ****P < 0.0001. (B) Kaplan–Meier plots analyzing mouse survival between treatment groups; vehicle vs ACTD *P = 0.032. (C–E) Orthotopic in vivo validation of ACTD in patient-derived TD2 tumors. (C) Waterfall plot generated from all TD2 replicates demonstrates the change in tumor growth as a percent of the mean bioluminescent signal of vehicle-treated mice. (D) Representative images of bioluminescence from vehicle, TMZ, and ACTD-treated mice (legend = Average photons/sec/mm2). (E) Percentage growth change (% growth) was tested by one-way ANOVA and Tukey’s multiple comparison tests. Significance = *P < 0.05, **P < 0.01, ***P < 0.001, and ****P < 0.0001.

