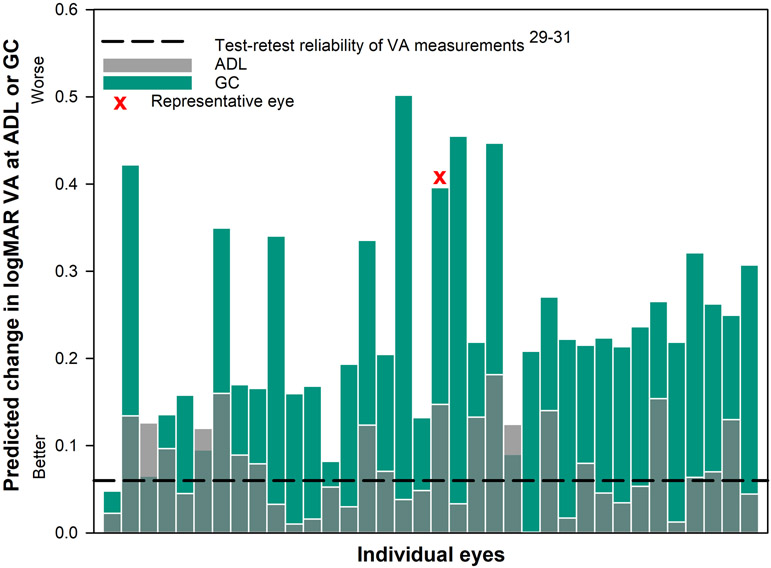
Figure 7.
The predicted loss in logMAR visual acuity28 for each individual eye with corneal ectasia when the wavefront-guided correction was located at the average decentered location (ADL: gray transparent bars) and the geometric center (GC: green bars) of each scleral lens. The dashed black line represents the threshold change of 0.06 logMAR or 3 letters based on test-retest reliability of acuity measurements.29-31 Nineteen out of 36 eyes at the ADL and 35 out of 36 eyes at the GC had a predicted loss in visual acuity of more than three letters (0.06 logMAR).

