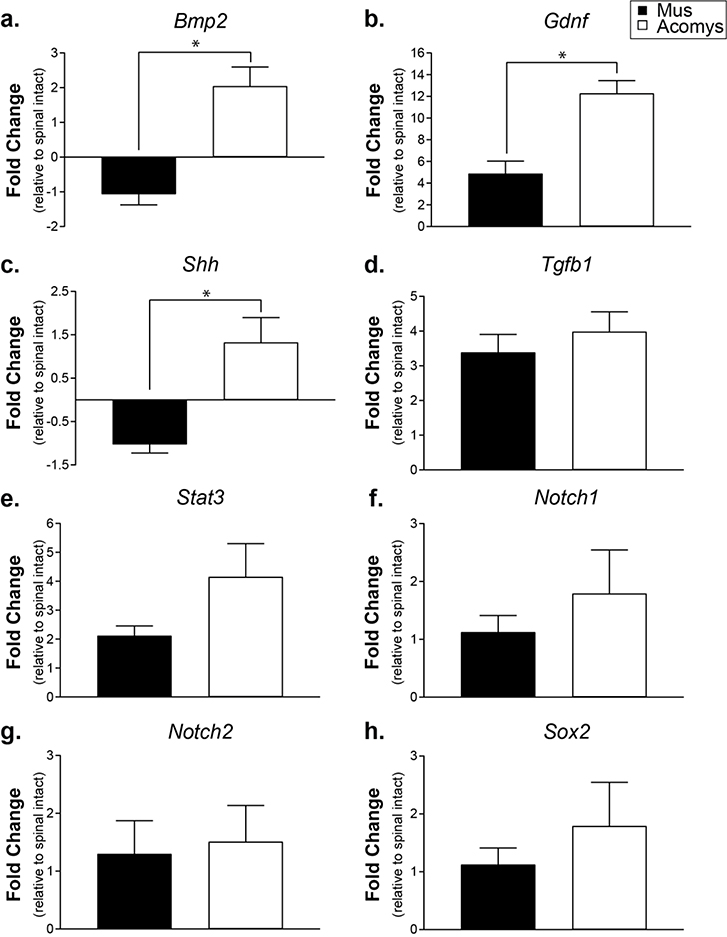
Figure 3:
Gene expression levels at 3 days post-SCI expressed as fold change compared to spinal intact controls determined by RT-qPCR using species-specific primers. a. Bmp2 (bone morphogenetic protein 2). b. Gdnf (glial derived neurotrophic factor). c. Shh (sonic hedgehog). d. Tgfb1 (transforming growth factor β1). e. Stat3 (signal transducer and activator of transcription 3). f. Notch1 (Notch homolog 1, translocation-associated). g. Notch2 (Notch homolog 2, translocation-associated). h. Sox2 (SRY (sex determining region Y)-box 2). Data shown are means ± standard error. * = P < 0.05.

