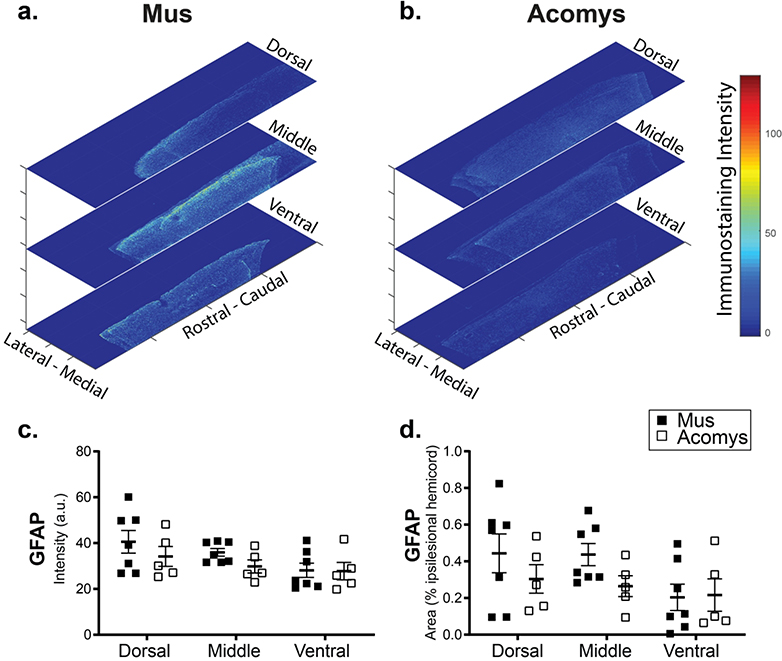
Figure 7:
Representative heat maps of the intensity of GFAP staining at the epicenter for Mus (a) and Acomys (b). Note: the size of heat map images are the ROI that were used for the analysis. Quantification of the intensity of GFAP staining (arbitrary units, c) and normalized to the size of the ROI (% ipsilesional hemicord, d) within the dorsal, middle, and ventral spinal regions.

