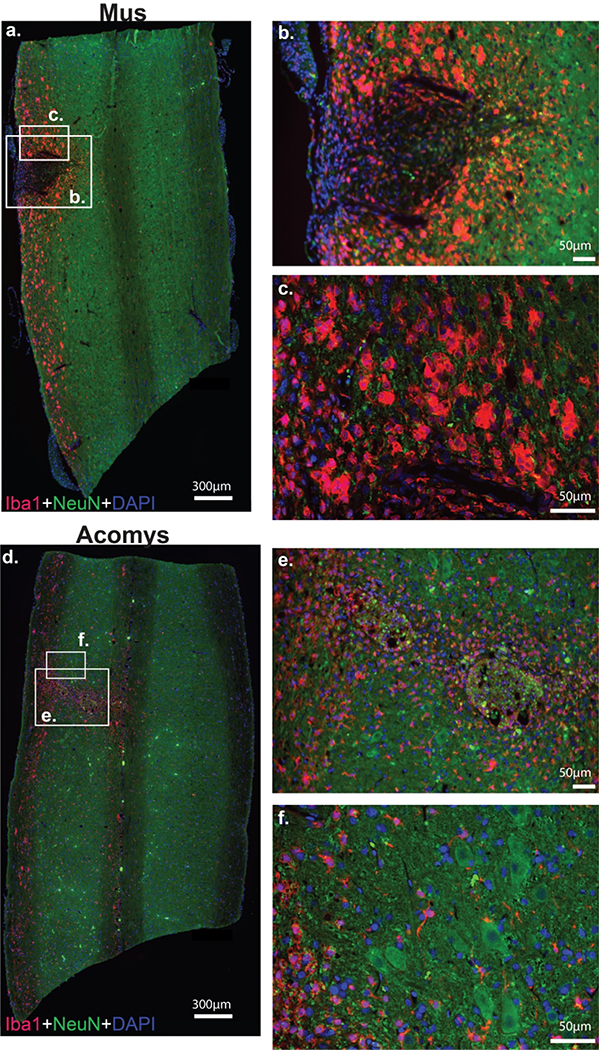
Figure 8:
Photomicrographs of IBA1 (red), NeuN (green) and DAPI (blue) staining 4 weeks post-SCI in Mus (a-c) and Acomys (d-f). Representative longitudinal cervical spinal images (C2-C6) depicting macrophages/microglia (IBA1), neurons (NeuN), and nuclei (DAPI) in and around the spinal lesion in Mus (a) and Acomys (d). High magnification images of the lesion epicenter shown in panel a for Mus (b,c) and panel d for Acomys (e,f). Note: linear adjustments were performed on representative images (see Materials and Methods section for details).

