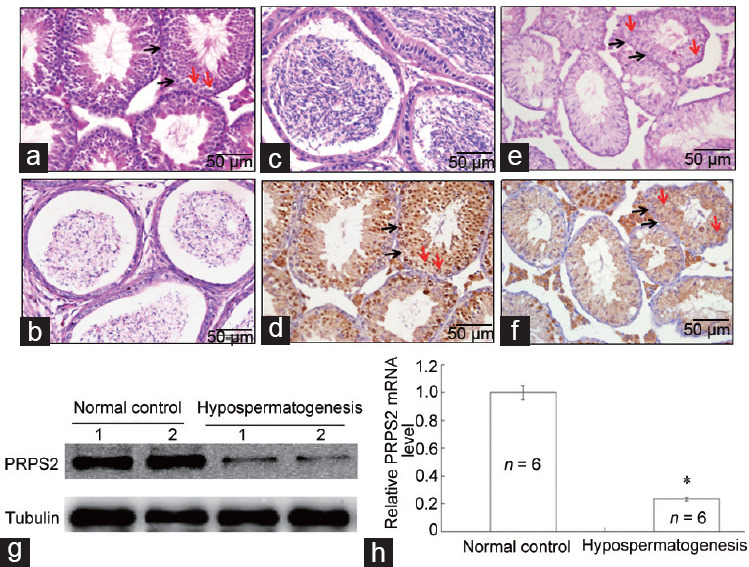
Figure 2.

Correlation of PRPS2 expression with hypospermatogenesis. (a) H and E staining of the testis with normal spermatogenesis. (b) H and E staining of normal cauda epididymidis. (c) H and E staining of a testis with hypospermatogenesis. (d) H and E staining of cauda epididymidis in hypospermatogenesis. (e) PRPS2 expression was detected in normal testis by IHC. (f) PRPS2 expression was detected in a testis with hypospermatogenesis by IHC. Scale bars = 50 μm. (g) PRPS2 expression was detected in testis with normal spermatogenesis and hypospermatogenesis by Western blot. (h) PRPS2 expression was detected in testis tissues with normal spermatogenesis and hypospermatogenesis by qRT-PCR. *Hypospermatogenesis group compared with normal control, P < 0.05 by independent-samples t-test. Red arrow: spermatogonia; Black arrow: spermatocyte. PRPS2: phosphoribosyl-pyrophosphate synthetase 2; H and E: hematoxylinand and eosin; IHC: immunohistochemical; qRT-PCR: quantitative real-time polymerase chain reaction.
