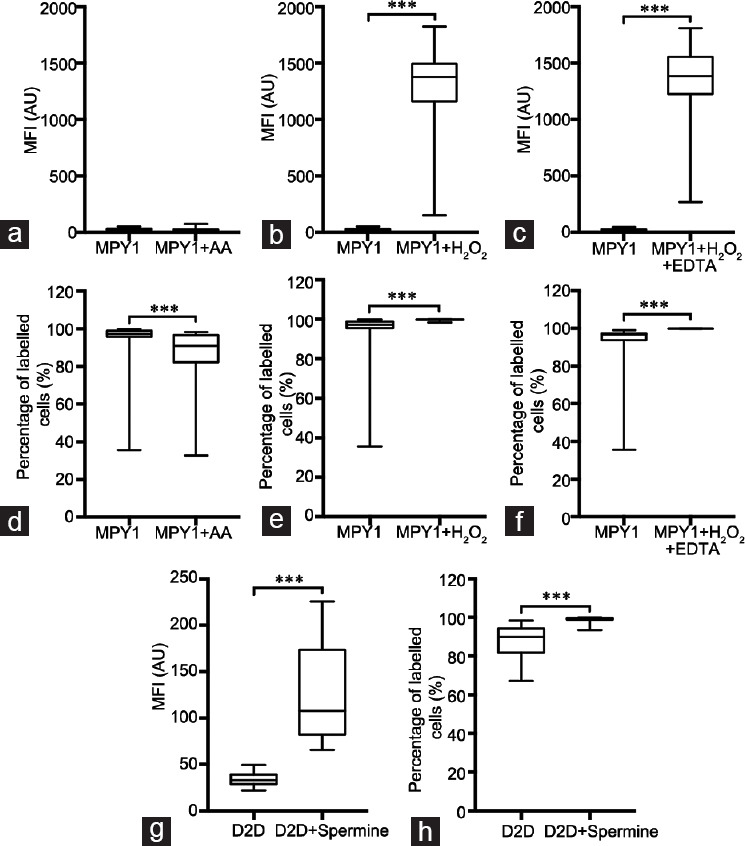
Figure 4.

Assessment of MFI and percentage of labeled cells in the sperm populations labeled with MitoPY1 and DAF-2 DA. (a–c) MFI values were obtained through FC for MitoPY1 and compared to the positive controls: (a) MPY1 versus MPY1 + AA (n = 28), (b) MPY1 versus MPY1 + H2O2 (n = 30) and (c) MPY1 versus MPY1 + H2O2 + EDTA (n = 14); (d–f) PLC values were obtained through FC for MitoPY1 and compared to the positive controls: (d) MPY1 versus MPY1 + AA (n = 28), (e) MPY1 versus MPY1 + H2O2 (n = 30) and (f) MitoPY1 versus MPY1 + H2O2 + EDTA (n = 14); (g) MFI and (h) PLC values were obtained through FC for DAF-2 DA and compared to the positive control: (g) D2D versus D2D + Spermine (n = 28), (h) D2D versus D2D + Spermine (n = 28). All data present a non-Gaussian distribution; therefore, the Wilcoxon test was performed. Data are presented as quartiles, Q1, Q2 (median) and Q3. ***P < 0.001. MPY1: MitoPY1; D2D: DAF-2 DA; AA: antimycin A; FC: flow cytometry; EDTA: ethylenediamine tetra acetic acid; MFI: mean fluorescence intensity; PLC: percentage of labeled cells.
