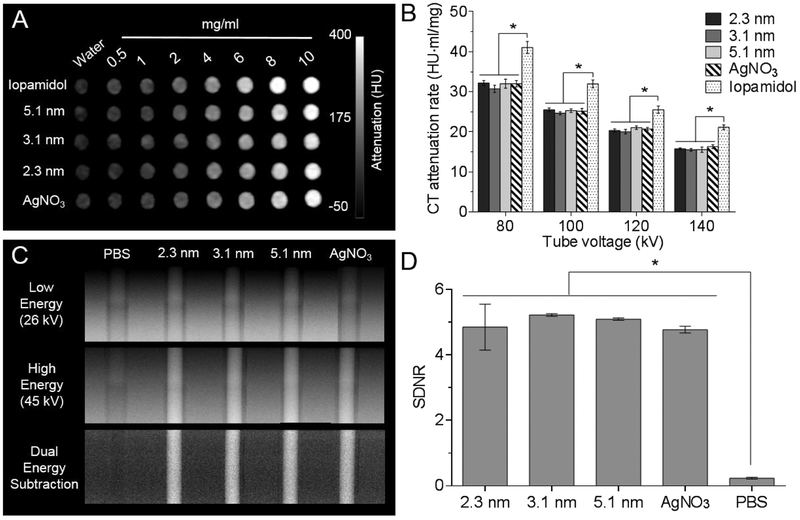
Figure 4.
Phantom imaging of different agents with DEM and CT. (A) CT phantom image at 80 kV and (B) CT attenuation rates for each tube voltage. (C) DEM phantom images and (D) signal difference-to-noise ratios calculated from DE subtraction images in (C). Error bars are one standard deviation in all cases. * indicates P < 0.05 (two-way ANOVA and one-way ANOVA for panels B and D, respectively, with Tukey’s multiple comparisons tests).

