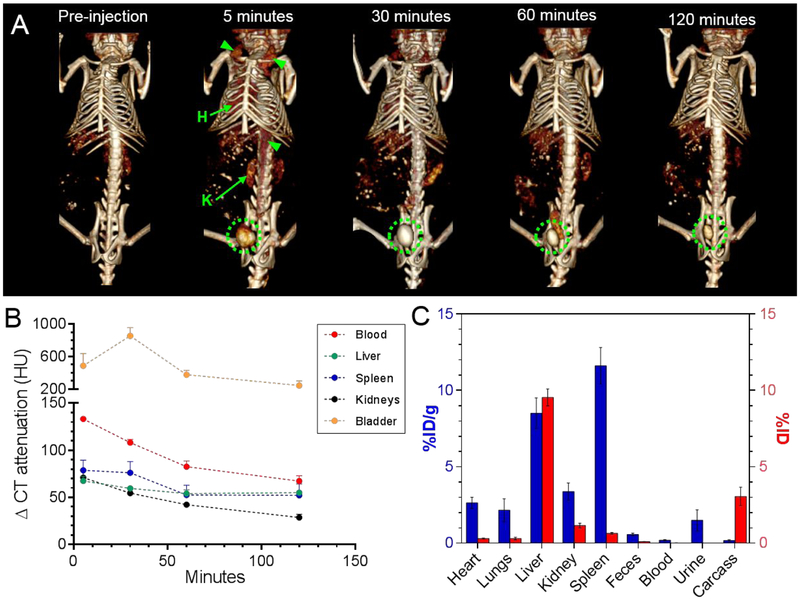
Figure 5.
(A) Representative 3D volume rendered CT images of a mouse injected with Ag2S-NP that have an average core diameter of 3.1 nm. The images are shown with a window level of 500 HU and window width of 200 HU. Green arrowheads mark the blood vessels and green circles indicate the bladder. Hearts and kidneys are labeled H and K, respectively. Some attenuation from food minerals were observed in the abdomen before injection. (B) The change in CT attenuation in different organs of mice at different time points compared to pre-injection. (C) Biodistribution of Ag2S-NP with an average core size of 3.1 nm in major organs and remaining carcasses at 24 hours p.i. as determined by ICP-OES. The values are given in units of %ID per gram and %ID as indicated by the blue (left y-axis) and red (right y-axis) bars, respectively. Error bars are standard error of mean. Some error bars are smaller than the data point marker and are thus not visible.

