
Fig. 2.
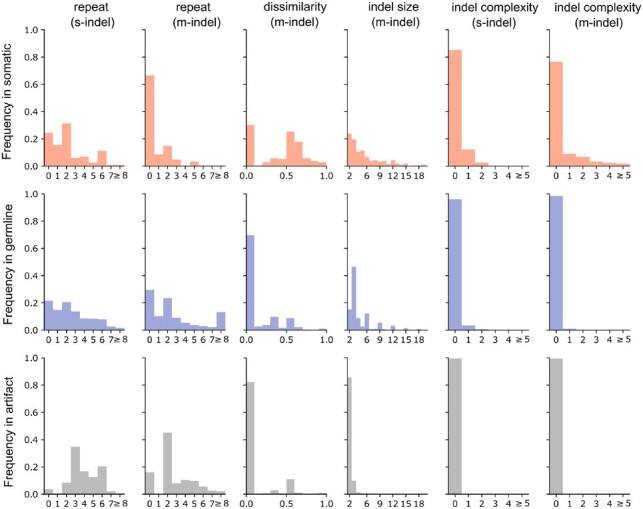
Distribution of somatic, germline and artifact indels based on features selected in the trained model. The complexity feature was not selected for m-indel (likely due to the overlapping with the dissimilarity feature) but shown for comparison with s-indel. Distribution of somatic (top panel, red), germline line (middle panel, blue) and artifacts (bottom panel, gray) are shown in histogram for each feature